[ad_1]
AlphaStreet Newsdesk powered by AlphaStreet Intelligence
Guidance adjusted Flat to 4%|Stock $307.10 (+1.5%)
EPS YoY -3.7%|Rev YoY +4.8%|Net Margin 7.9%
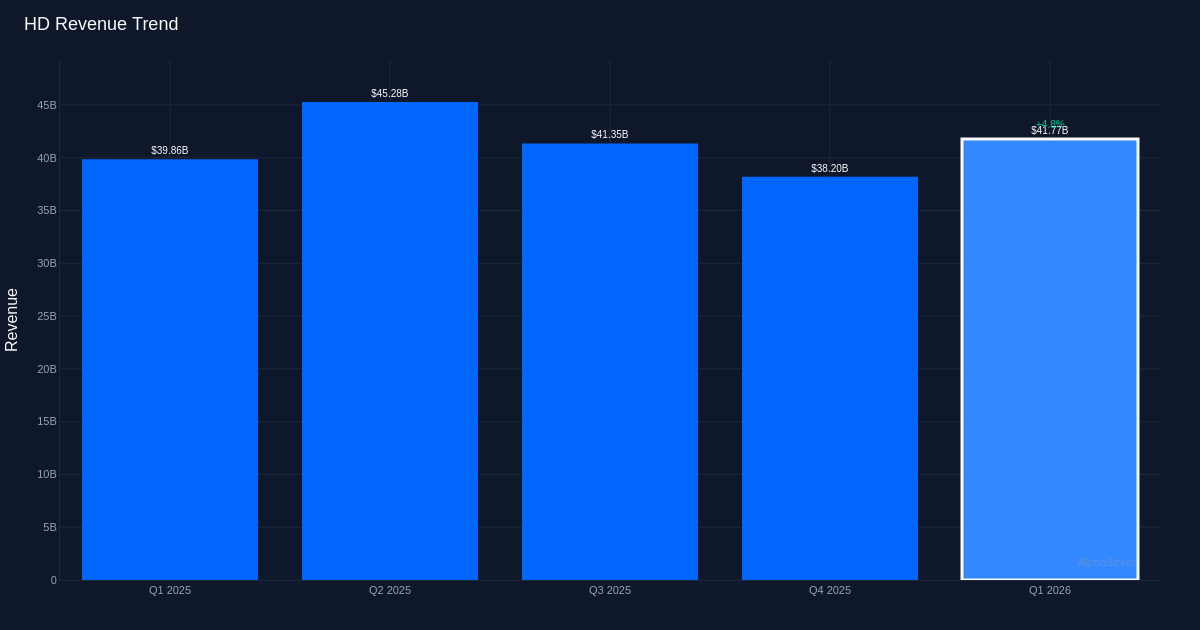
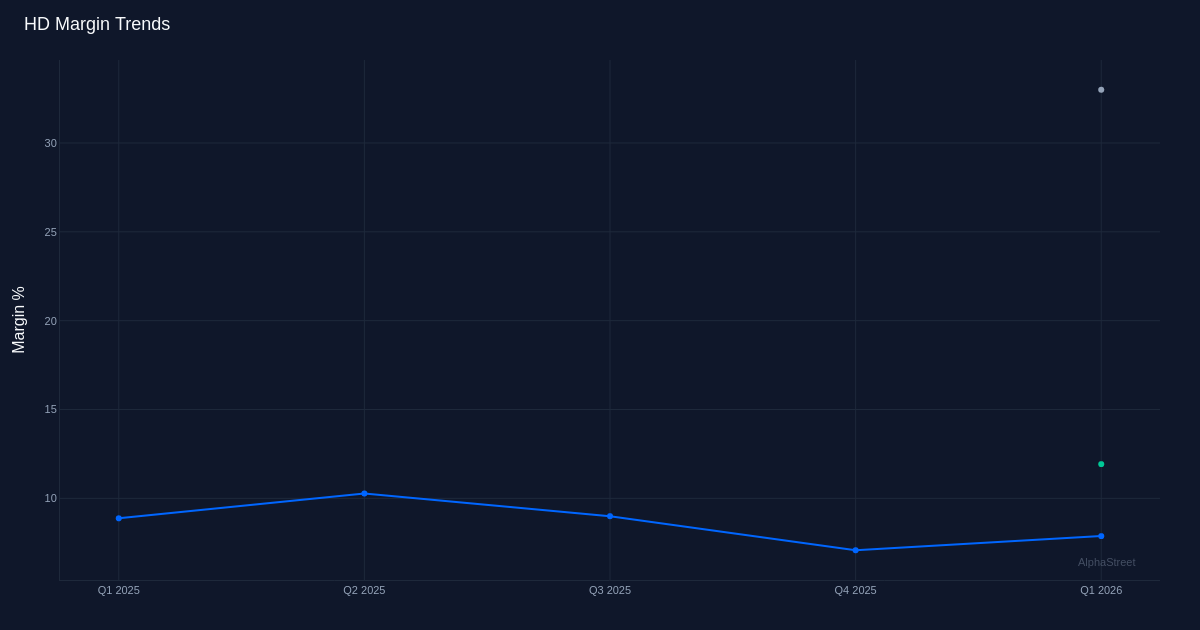
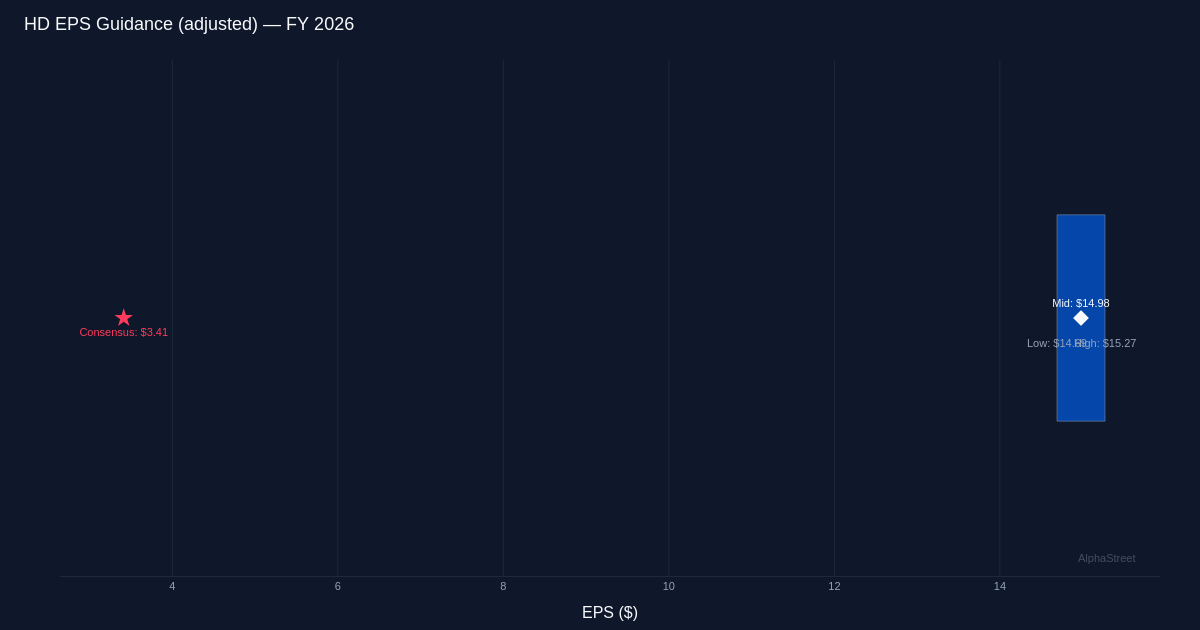
Marginal beat masks profitability pressure. The Home Depot delivered Q1 2026 results that technically exceeded expectations, with adjusted EPS of $3.43 edging past the $3.41 consensus estimate by 0.6% and revenue of $41.77B topping the $41.54B forecast by 0.5%. Yet beneath these headline figures lies a more complex narrative: while the company generated $1.9B in incremental sales compared to the prior year—a revenue growth rate of 4.8%—profitability declined meaningfully. Net income contracted to $3.29B from $3.43B a year earlier, and the net margin compressed to 7.9% from 8.5%. This disconnect between revenue expansion and margin erosion signals that growth came at a cost, raising questions about pricing power and operational efficiency in the current environment.
Operating leverage deteriorated despite top-line gains. The margin compression story extends beyond the bottom line. Operating margin stood at 11.9% with operating income of $4.98B, while gross margin registered 33.0% on gross profit of $13.78B. The year-over-year comparison reveals the underlying pressure: EPS declined 3.7% from $3.56 to $3.43 despite revenue climbing 4.8%. Management acknowledged the operational headwinds directly, noting that “during the first quarter, operating expense as a percent of sales increased approximately 20 basis points to 21.1% compared to the first quarter of 2025.” This 20-basis-point expansion in the expense ratio effectively consumed margin gains and then some, transforming what should have been earnings growth into an earnings decline. The divergence between revenue trajectory and earnings trajectory suggests the company is investing heavily to defend market share or facing structural cost pressures that pricing actions cannot fully offset.
Comparable sales growth reveals traffic challenge. The modest comparable sales increase of 0.6% provides critical context for the $1.9B revenue gain management highlighted, stating “in the first quarter, total sales were $41.8 billion, an increase of $1.9 billion, or 4.8% from last year.” With the company operating 2,361 total retail stores, the gap between total revenue growth of 4.8% and comparable sales growth of just 0.6% indicates that much of the expansion came from new store openings or other non-comparable channels rather than organic strength in the existing base. This distinction matters: comp growth reflects underlying demand trends and same-store productivity, while total revenue can be inflated by square footage additions that carry their own cost structures. The anemic comp performance suggests consumer demand in home improvement remains tepid, consistent with a housing market constrained by elevated mortgage rates and reduced home turnover.
Cash generation provides balance sheet flexibility. Despite the earnings pressure, The Home Depot demonstrated robust cash flow characteristics with operating cash flow of $6.03B and free cash flow of $5.19B in the quarter. The $844M difference between operating and free cash flow implies manageable capital expenditure requirements relative to the operational cash engine. This cash generation capability provides strategic flexibility to fund store expansion, shareholder returns, or defensive investments if margin pressures persist. The strength of cash conversion becomes particularly valuable if the earnings quality concerns translate into sustained profitability headwinds.
Guidance implies modest recovery trajectory. Management established full-year FY 2026 adjusted EPS guidance ranging from flat to 4%. The guidance framework indicates management sees the margin pressure as manageable rather than structural, though investors will scrutinize whether operational improvements materialize.
Stock reaction. Shares were up 1.6% in midday trade.
What to Watch: The trajectory of operating expense leverage in Q2 will determine whether the 20-basis-point increase represents temporary investment or structural cost inflation. Comparable sales trends deserve close monitoring as the true measure of underlying demand strength beyond new store contributions. Management’s ability to expand the net margin back toward the prior-year 8.5% level would validate the guidance framework and suggest transient rather than permanent margin pressure. Finally, housing market indicators including existing home sales and home price appreciation will signal whether the core end market is stabilizing or faces further headwinds that could constrain customer spending on home improvement projects.
This content is for informational purposes only and should not be considered investment advice. AlphaStreet Intelligence analyzes financial data using AI to deliver fast and accurate market information. Human editors verify content.
[ad_2]
Source link