
Dogecoin starts to lose value as soon as it falls outside the parallel rising channel. At the moment, Dogecoin is trading sideways. Over the last 24 hours, DOGE is up 0.3%, which confirms that the coin is stuck in a consolidated price area.
Last week, Dogecoin brought close to 4% gains. The technical outlook for Dogecoin price shows that the bearish momentum is set. The demand and accumulation for meme-coin shrinks when it starts to trade sideways.
The meme coin recorded a price pullback after breaching the $0.88 resistance level. Over the last few days, Dogecoin has witnessed an influx of buyers; however, selling pressure has been amplified at press time.
Overall, the meme coin has a bullish structure as it managed to keep the price above the 200-Simple Moving Average line. In the shorter time frame, Dogecoin may be close to the $0.74 level before recovering or falling further. DOGE’s market capitalization is slightly down, indicating that selling pressure has risen on the chart.
Dogecoin Price Analysis: One Day Chart
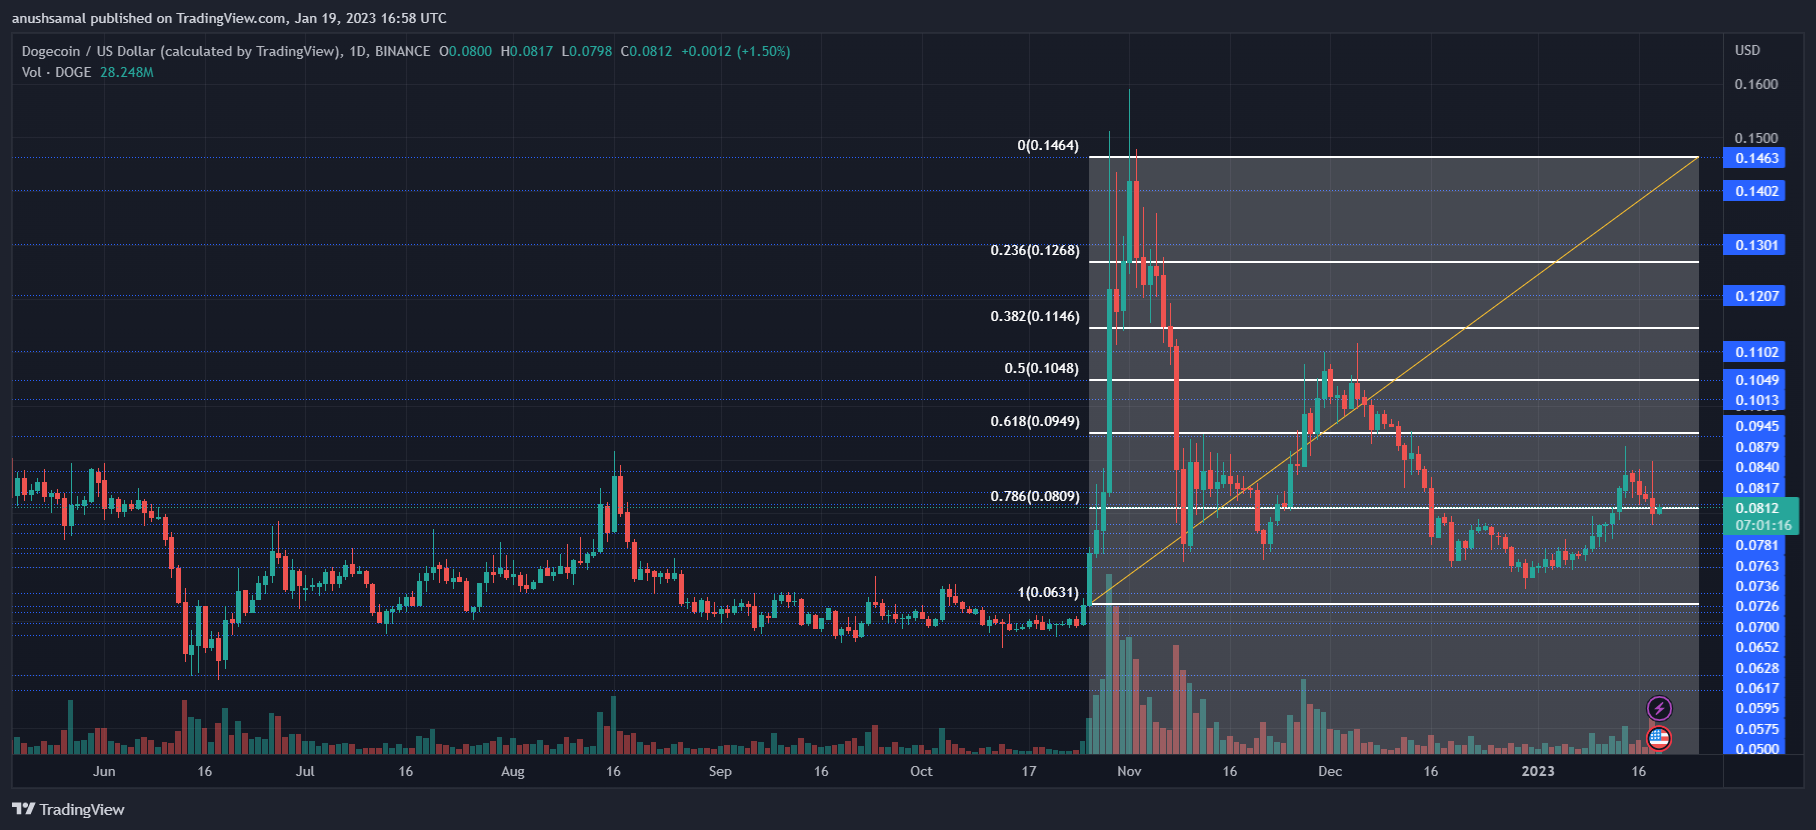
DOGE is trading at $0.81 at the time of writing. The coin corrected itself after reaching the $0.88 price level. Immediate resistance for the meme coin stands at $0.87, close to the 61.8% Fibonacci retracement level. Moving past the $0.87 mark could push DOGE to the $0.104 resistance mark.
On the other hand, if Dogecoin fails to stay above the $0.74 support level, it could drop to $0.66. If demand picks up slightly, it is unlikely that Dogecoin will fall below the price floor of $0.74. The number of Dogecoin traded in the last session decreased, indicating that there is a decreasing buying pressure.
Technical Analysis
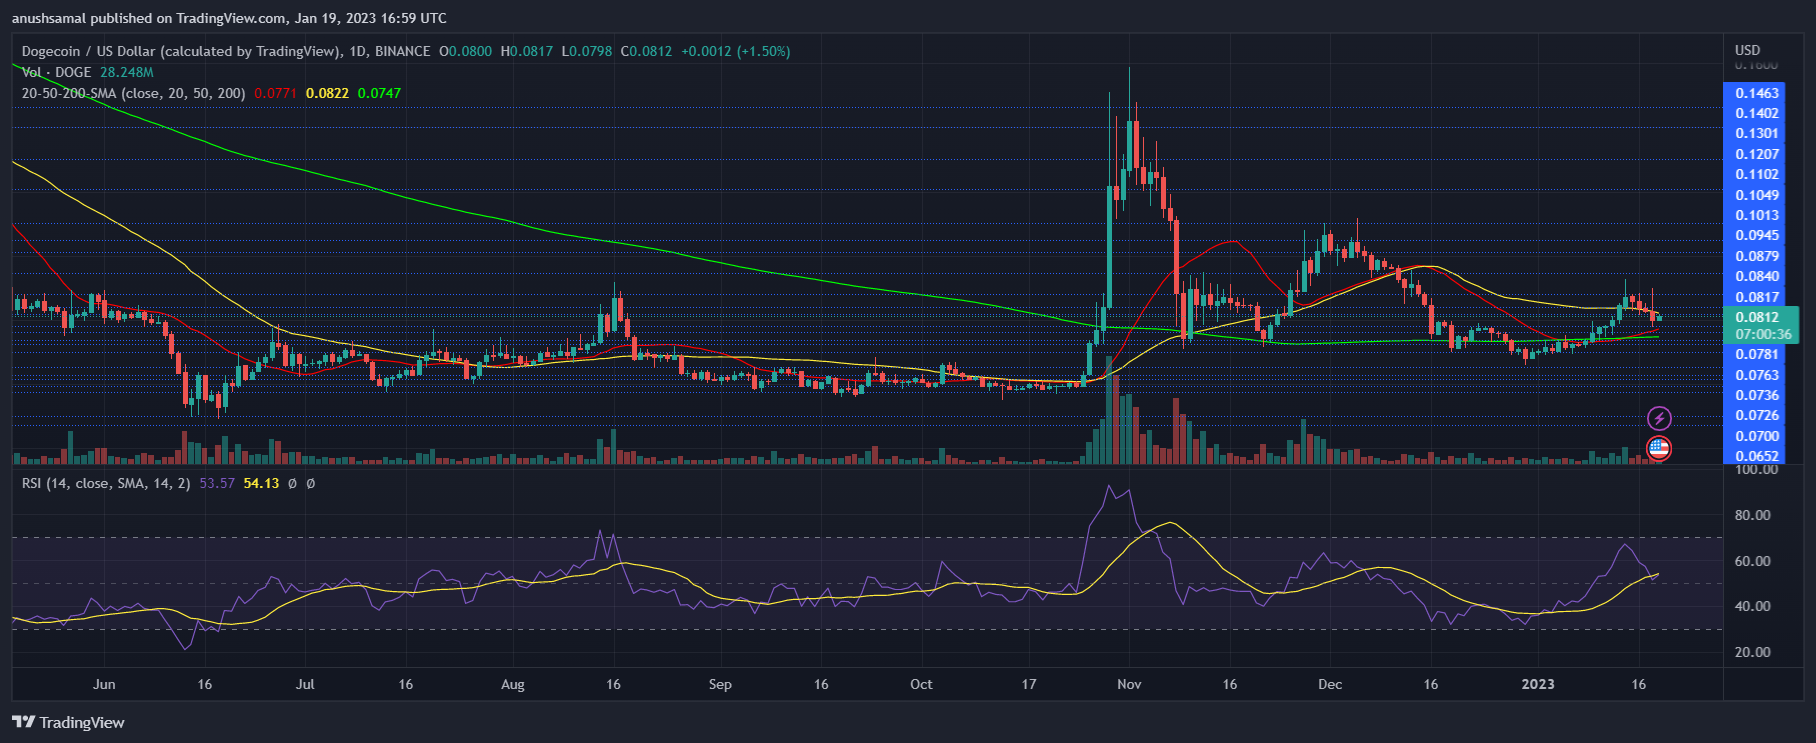
The meme coin has reflected a decline in demand as buyers have started to decline on the daily chart. The Relative Strength Index (RSI) retraced after standing close to the 70-mark, indicating an excess of buyers over sellers. This suggests that the meme coin is correcting itself at press time.
The RSI, however, remains above the 50-mark, indicating that buying strength is greater than selling strength. The price of Dogecoin is above the 20-Simple Moving Average (SMA), indicating that buyers are controlling the price momentum in the market.
It is also above the 50-SMA (yellow) and 200-SMA (green) lines, indicating bullishness. However, the coin formed a death cross where the 200-SMA line crossed over the 20-SMA line. The cross of death is accompanied by a significant decrease in value.
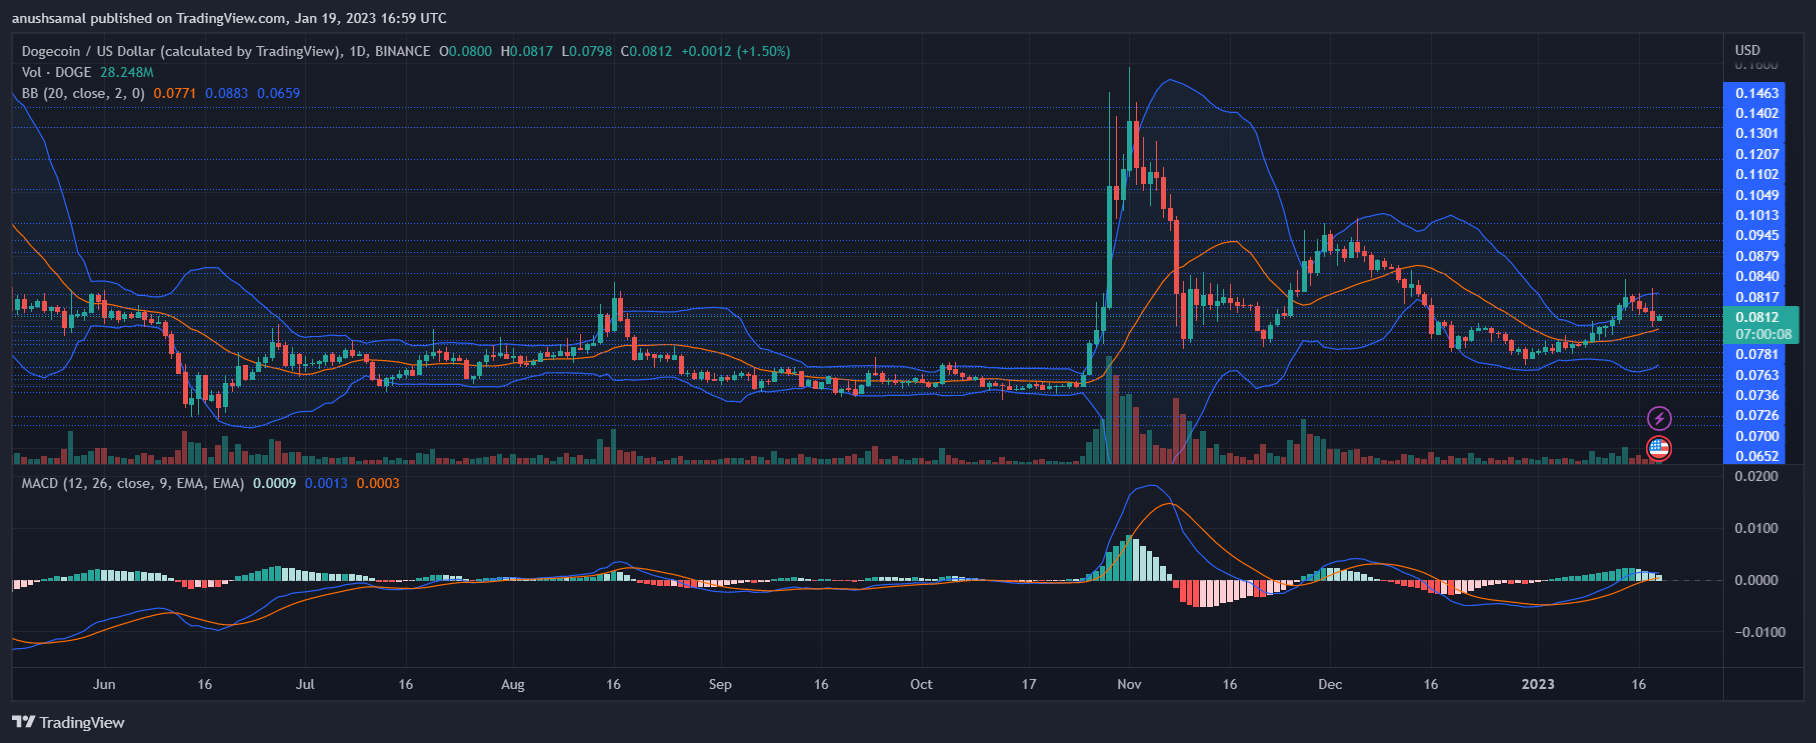
Meme-coin continues to display a buy signal on the intraday chart. The Moving Average Convergence Divergence, which shows price momentum and trend reversal, depicts a green signal bar that is tied to a buy signal.
This green histogram is shrinking, indicating that this is probably not a good time to buy the asset. In the same resonance, the Bollinger Bands suggest that volatility is increasing, which means that the price will change significantly during the next trading session.
Featured Images From UnSplash, Graphics From TradingView.com