
The price of Litecoin has shown a considerable recovery since reaching the bottom in December 2022. LTC has appreciated almost 50% in January this year. But now, the altcoin has witnessed a price pullback and is consolidating on the daily chart.
Over the last 24 hours, the price of Litecoin has decreased by 0.3%, which shows a range of movements. Altcoins also lost almost 3% of their market value. Litecoin’s technical outlook indicates bullish momentum as demand for the altcoin remains high on the daily chart.
Accumulation is also reflected in the same. Price recorded a decline as LTC receded from the overbought zone. Buyers still have the upper hand on the charts.
Continued accumulation will cause bears to secure Litecoin’s price action. The momentum will continue for the coming week, causing LTC to fall below the nearest support level. At the time of writing, LTC is trading 78% below its 2021 high set.
Litecoin Price Analysis: One Day Chart
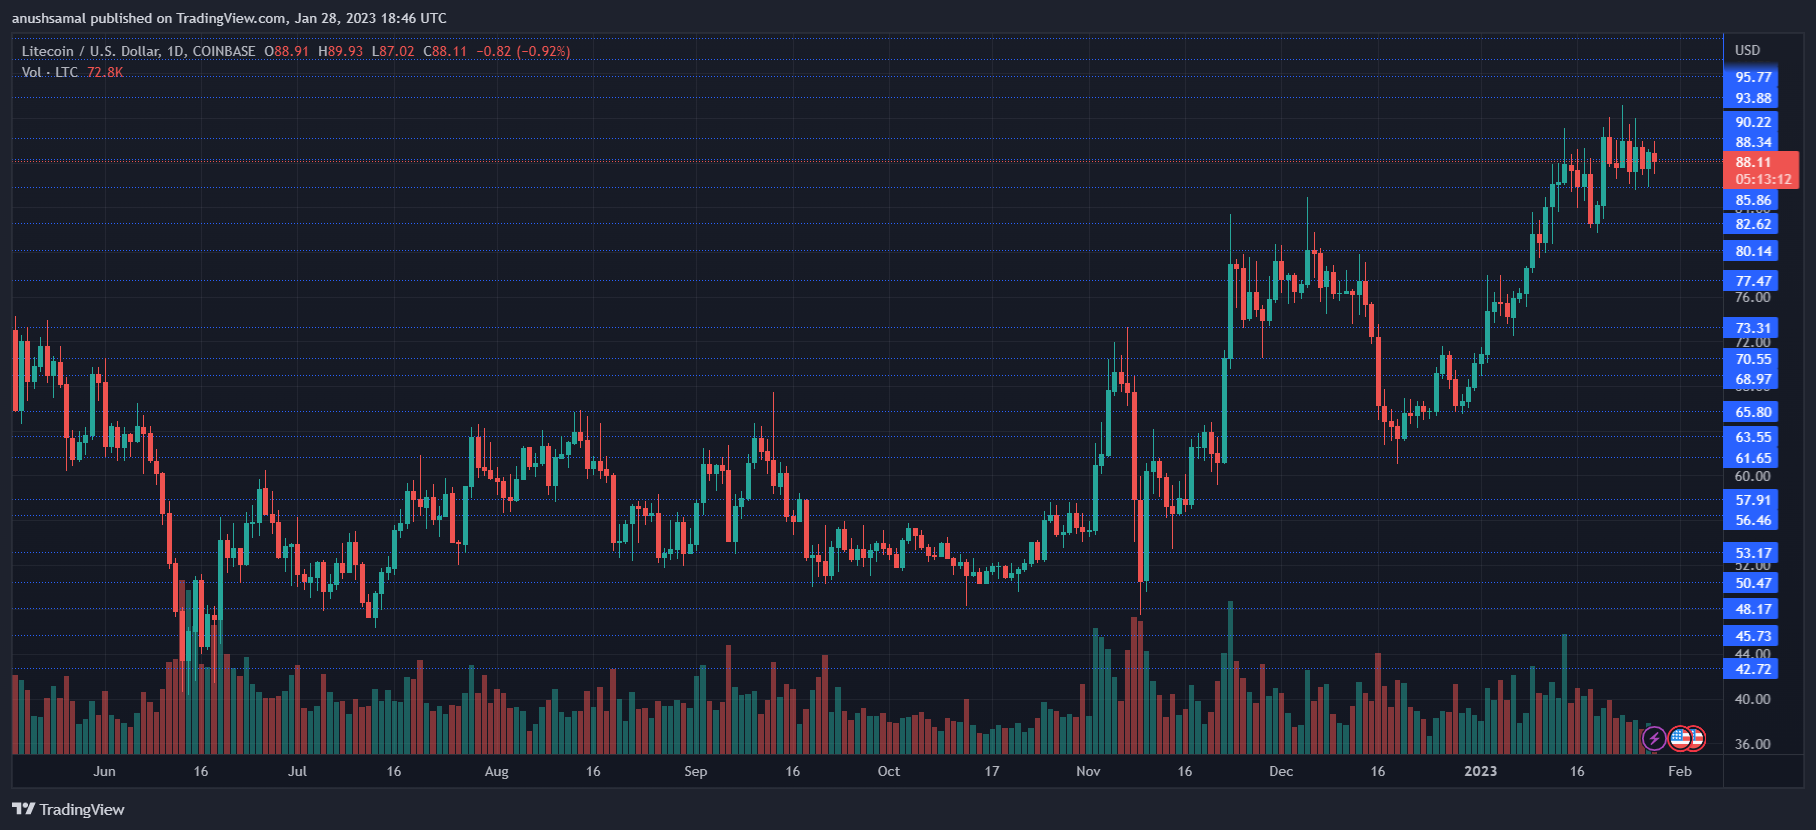
LTC is trading at $88.11 at the time of writing. The coin has broken several resistance lines over the past few weeks but failed to sustain the momentum. The LTC met two stiff resistance levels before starting to move south again.
Two important resistance lines for the coin are at $90 and $92. The immediate resistance stands at $90. If the demand for the altcoin remains steady, then LTC can try to break the $90 price mark.
On the flipside, the closest support line for the Litecoin price is at $86, and the continuous price correction will force LTC to fall below the $86 price mark and settle at $82. The amount of LTC traded in the last session was in the red, indicating a fall in the buyer.
Technical Analysis
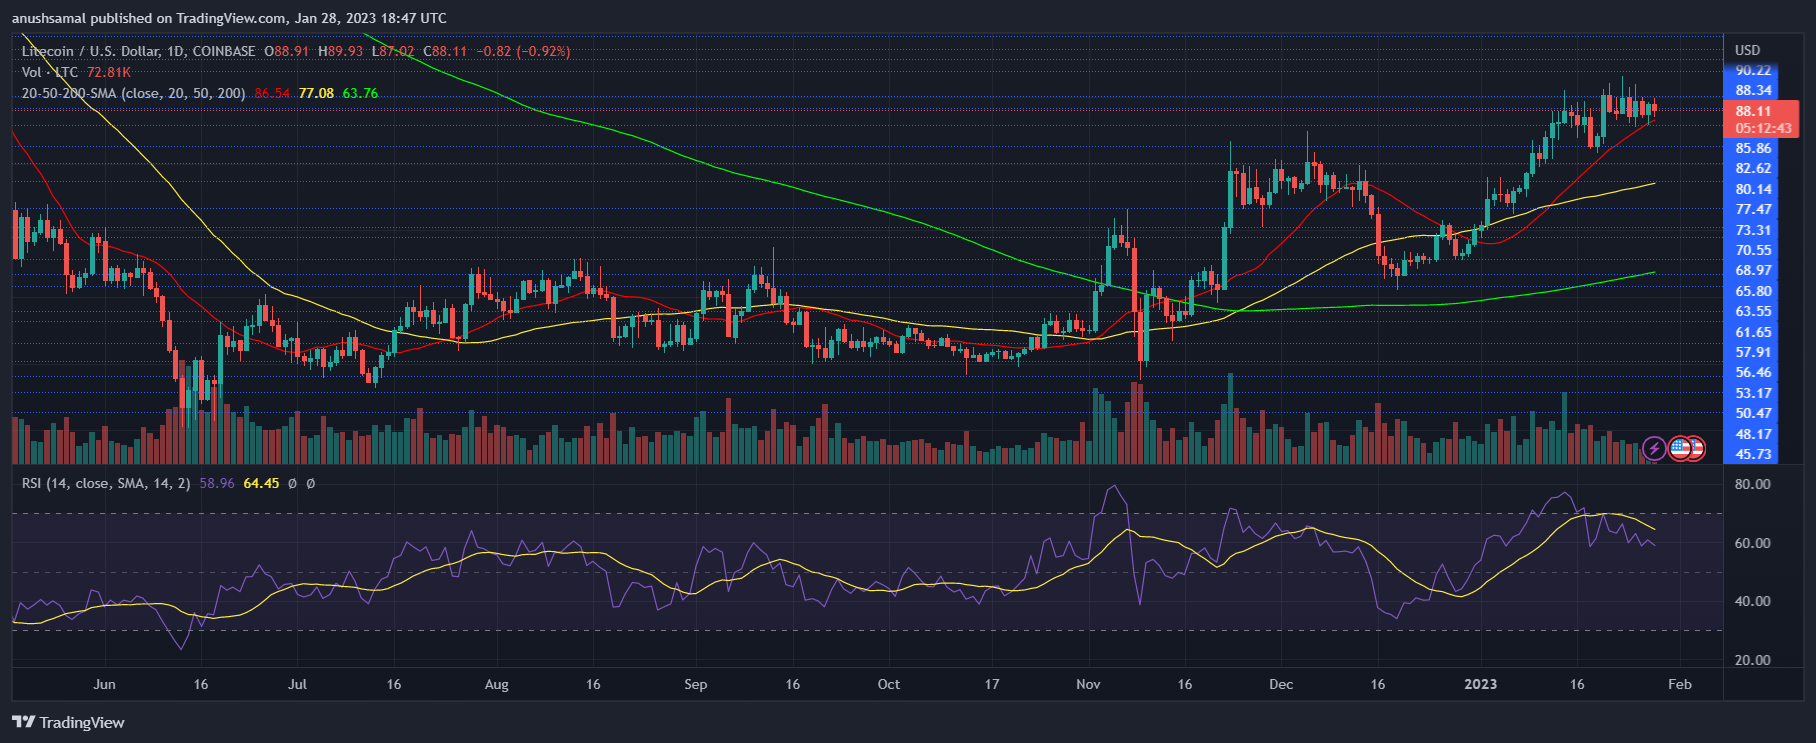
Altcoin has been hovering in overbought territory for several weeks now, and at the moment there is a little fall in demand for Litecoin. The Relative Strength Index stood a little below the 60 mark after recording a recent downtick indicating that demand has shrunk.
A reading near the 60 mark, however, indicates that buyers outnumbered sellers. In line with that, the price of LTC shot through the 20-Simple Moving Average (SMA) line as buyers pushed the price momentum in the market.
The coin is also above the 50-SMA (yellow) and 200-SMA (green) lines, indicating a bullish rise.
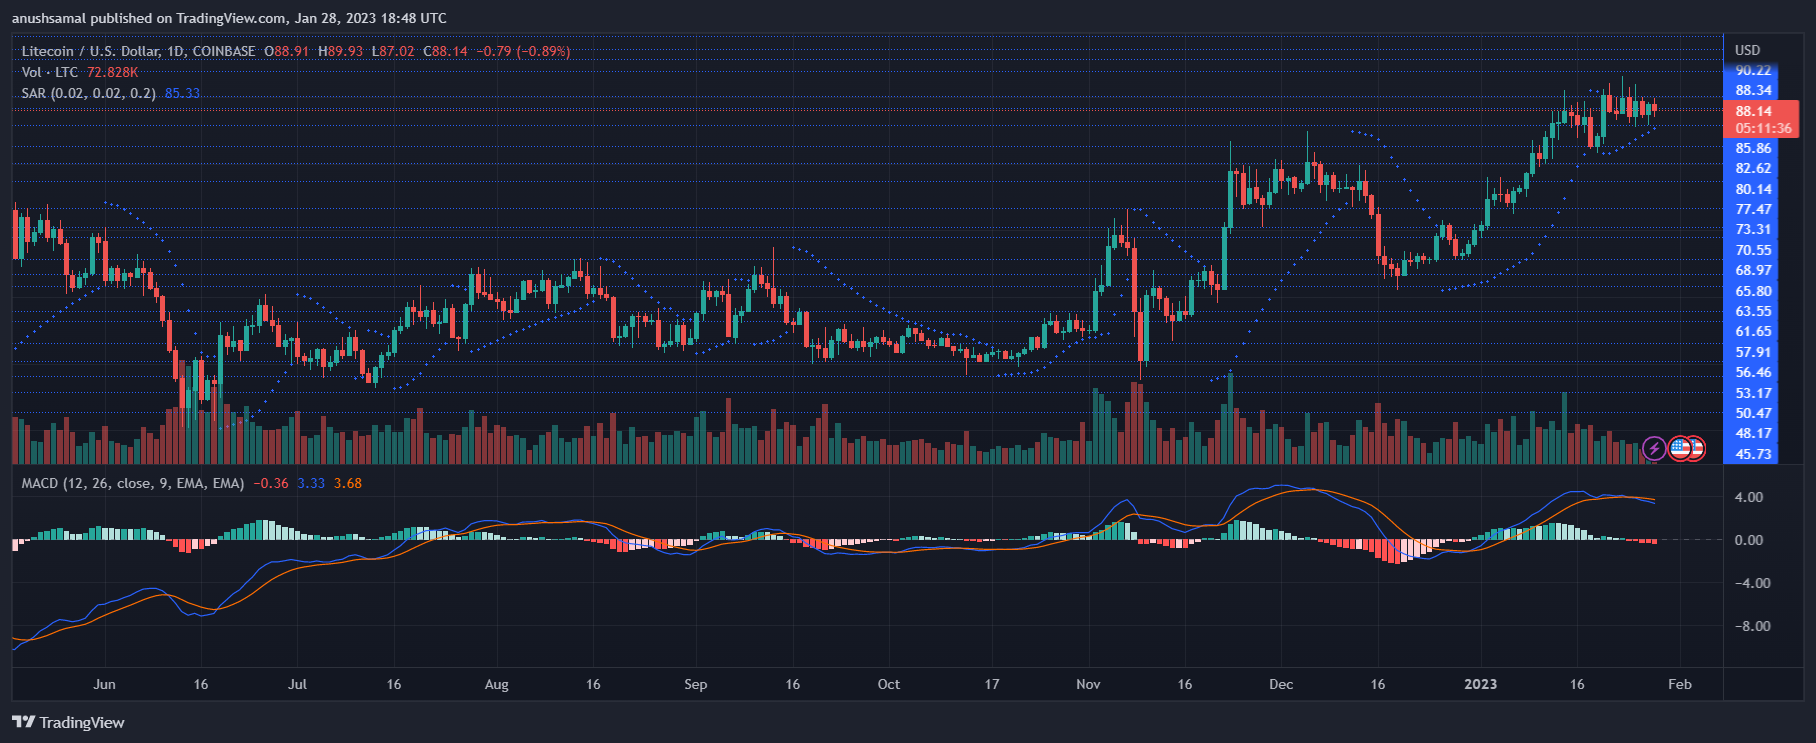
Regarding the decline in buying pressure, the LTC chart is displaying a sell signal on the one-day chart. Moving Average Convergence Divergence (MACD), which reflects market momentum, has a bearish crossover and forms a red signal bar that is tied to a sell signal.
This may indicate that the price will drop in the coming trading session. Parabolic SAR, an indicator that reads trends and changes in price momentum, is still positive. The dotted line is below the candlestick, indicating that the price of LTC is still positive.
Featured Images From UnSplash, Graphics From TradingView.com