Litecoin price has shown bullish sentiment over the past week after bouncing off the $81 resistance zone. In the last 24 hours, the altcoin jumped 2%, and in the last week, the price of LTC gained close to 6%.
As Bitcoin continues to trot up and is now eyeing the $23,000 price mark, other altcoins have reflected similar price sentiments. The technical view of Litecoin price has shown that the accumulation passed the overbought territory when Litecoin broke through the price area of $81.
It is expected for the coin to remain stable between the price levels of $81 and $88, respectively. When Litecoin traveled above the $88 price zone, the coin started to show a price correction. According to the indicators, Litecoin continues to remain very bullish on the chart, with the possibility of a price pullback.
Bullish momentum has gained strength since moving past the $86 price mark, so a move to the $90 mark is quick and easy for Litecoin. Historically, the $93 resistance mark has acted as a pullback area for the coin. LTC could reach the $93 level during the next trading session if Bitcoin continues to rise.
Litecoin Price Analysis: Daily Chart
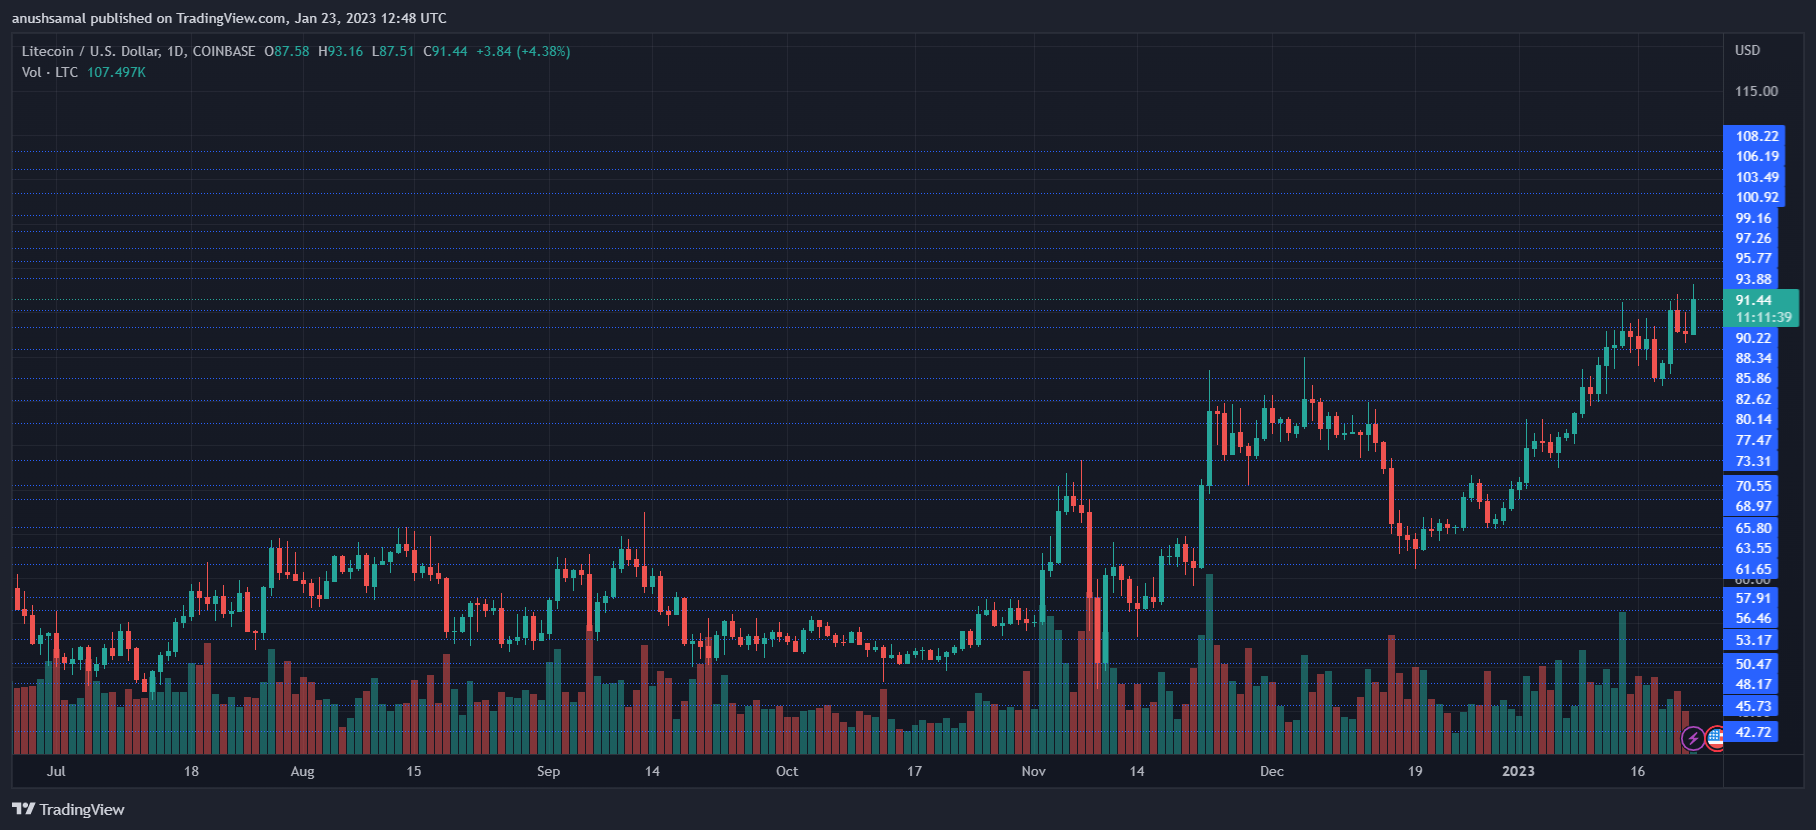
LTC is trading at $91 at the time of this writing. Over the past few weeks, Litecoin has crossed several resistance levels. The coin faces stiff resistance at $81 and has been rallying since crossing that level.
Overhead resistance for the coin stands at $93; this will act as an important price sign as LTC may experience a pullback before attempting to break the $106 resistance mark.
On the other hand, if Litecoin fails to stay above the $88 support line, it will cause sellers to outnumber buyers, causing the altcoin to drop to $80 and then $71. The amount of LTC traded in the last session is red, which indicates that there is a fall in the number of buyers.
Technical Analysis
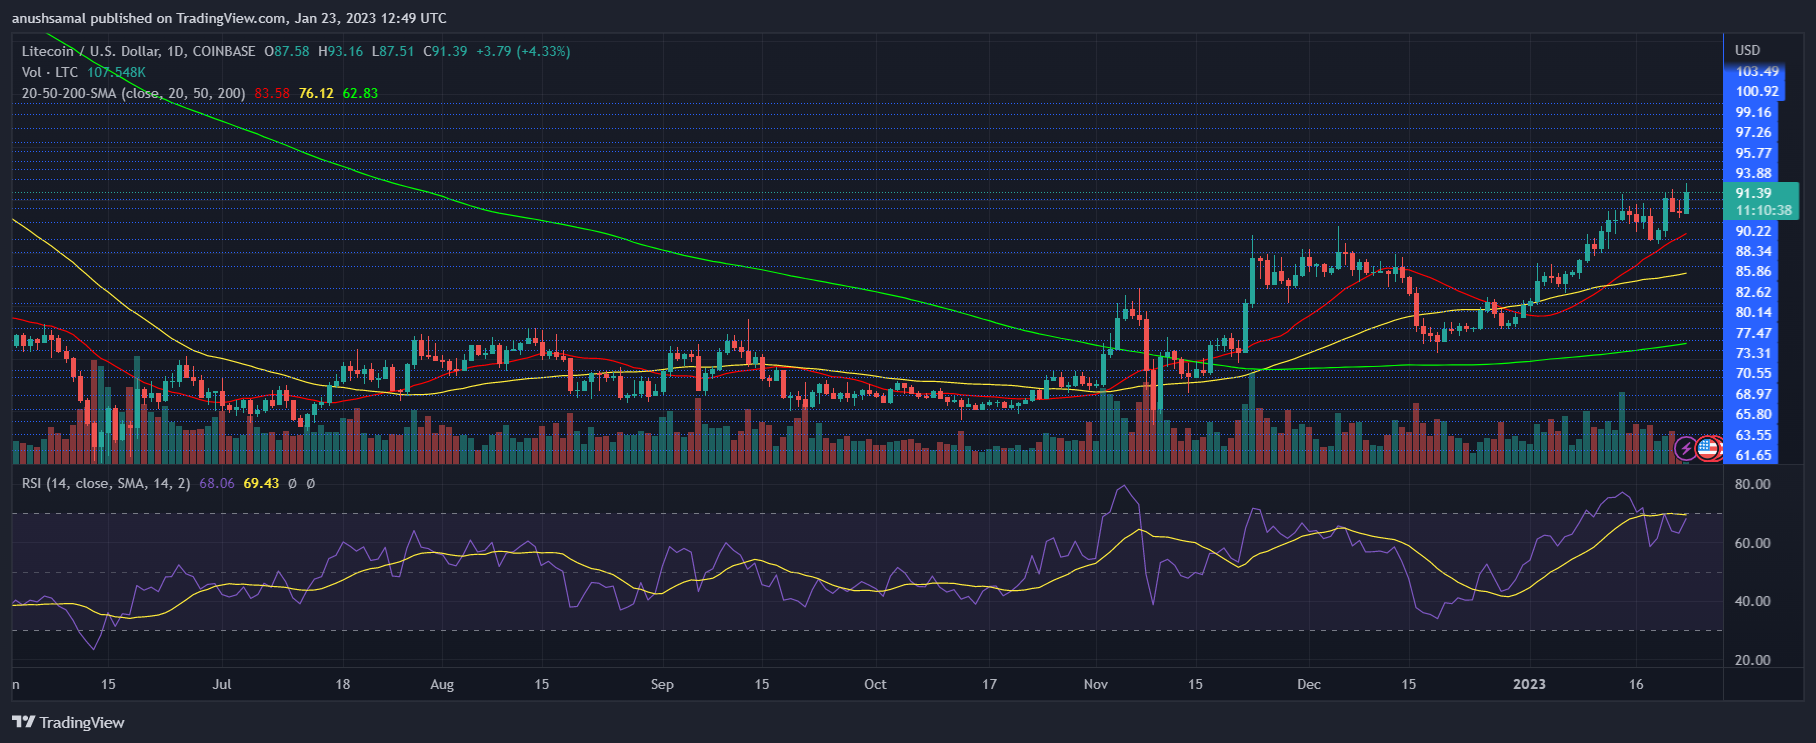
LTC is hovering over the overvalued zone, which indicates that there will be another price correction before it starts trading up again. The Relative Strength Index (RSI) stands at the 70 mark, which indicates that the asset is overbought.
A fall from the overvalued zone can drag the asset price below $88. Litecoin continues to reflect extreme bullishness as the price is above the 20-Simple Moving Average line.
This means that buyers are driving price momentum in the market. The coin is also above the 50-SMA and 200-SMA lines. However, the 50-SMA is above the 20-SMA, which is a sign of impending bearishness and indicates a price pullback.
Buy signals for the asset are starting to show a decline, which means buyers may exit the market over the next few trading sessions.
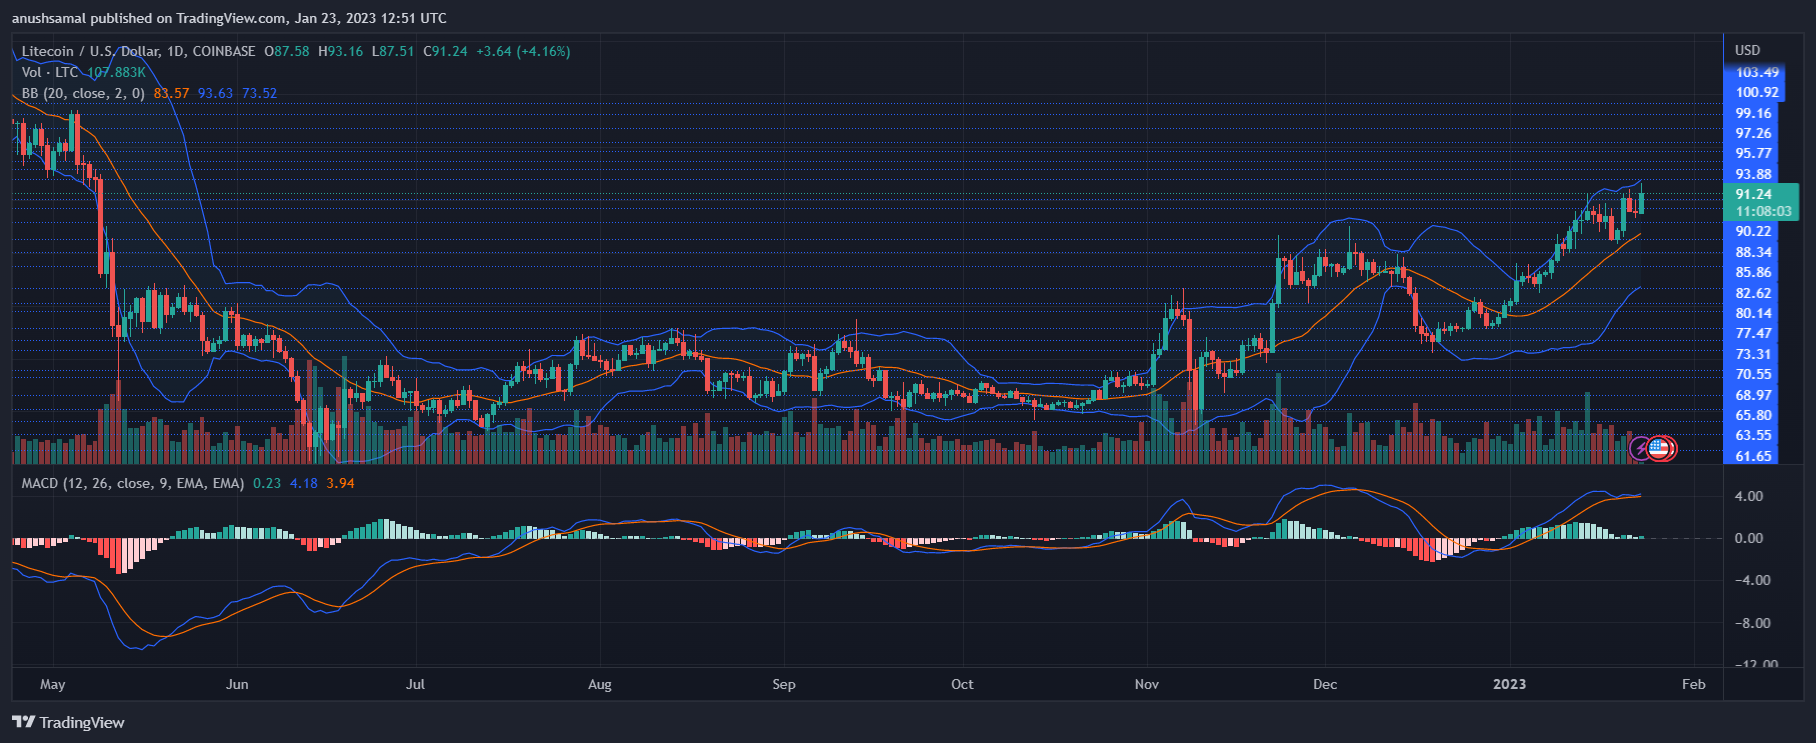
Moving Average Convergence Divergence (MACD) shows price momentum and reversals; is shown a receding green signal bar, which means incoming bearish price action.
Bollinger Bands indicate price fluctuations and volatility; band were far away, which is given the instability of the future price.
Featured Images From UnSplash, Graphics From TradingView.com