The price of Polkadot made significant gains over the past week after Bitcoin showed a recovery on the chart. Other Altcoins have also moved in the same direction. At the moment, however, the DOT has tried to issue direct resistance from $5.
In the past 24 hours, DOT has recorded a 2% drop, but this may be attributed to the decrease in demand for altcoins. The technical outlook for Polkadot remains bullish. Buyers and demand for altcoins should continue to increase, and soon DOT will travel above the $5 level to trade near the $6 level.
Accumulations have increased over the past week as buyers have outnumbered sellers at press time. It is critical, however, that the DOT exceeds the $5 mark, or the coin will start to trade below, resulting in the loss of investor interest.
The market structure for DOT remains bullish as the coin managed to turn some resistance marks towards support levels in the past week. A push from buyers will certainly strengthen the bull’s efforts to cross the rigid price ceiling of $4.90. Polkadot’s price is trading 91% below its 2021 high.
Polkadot Price Analysis: One Day Chart
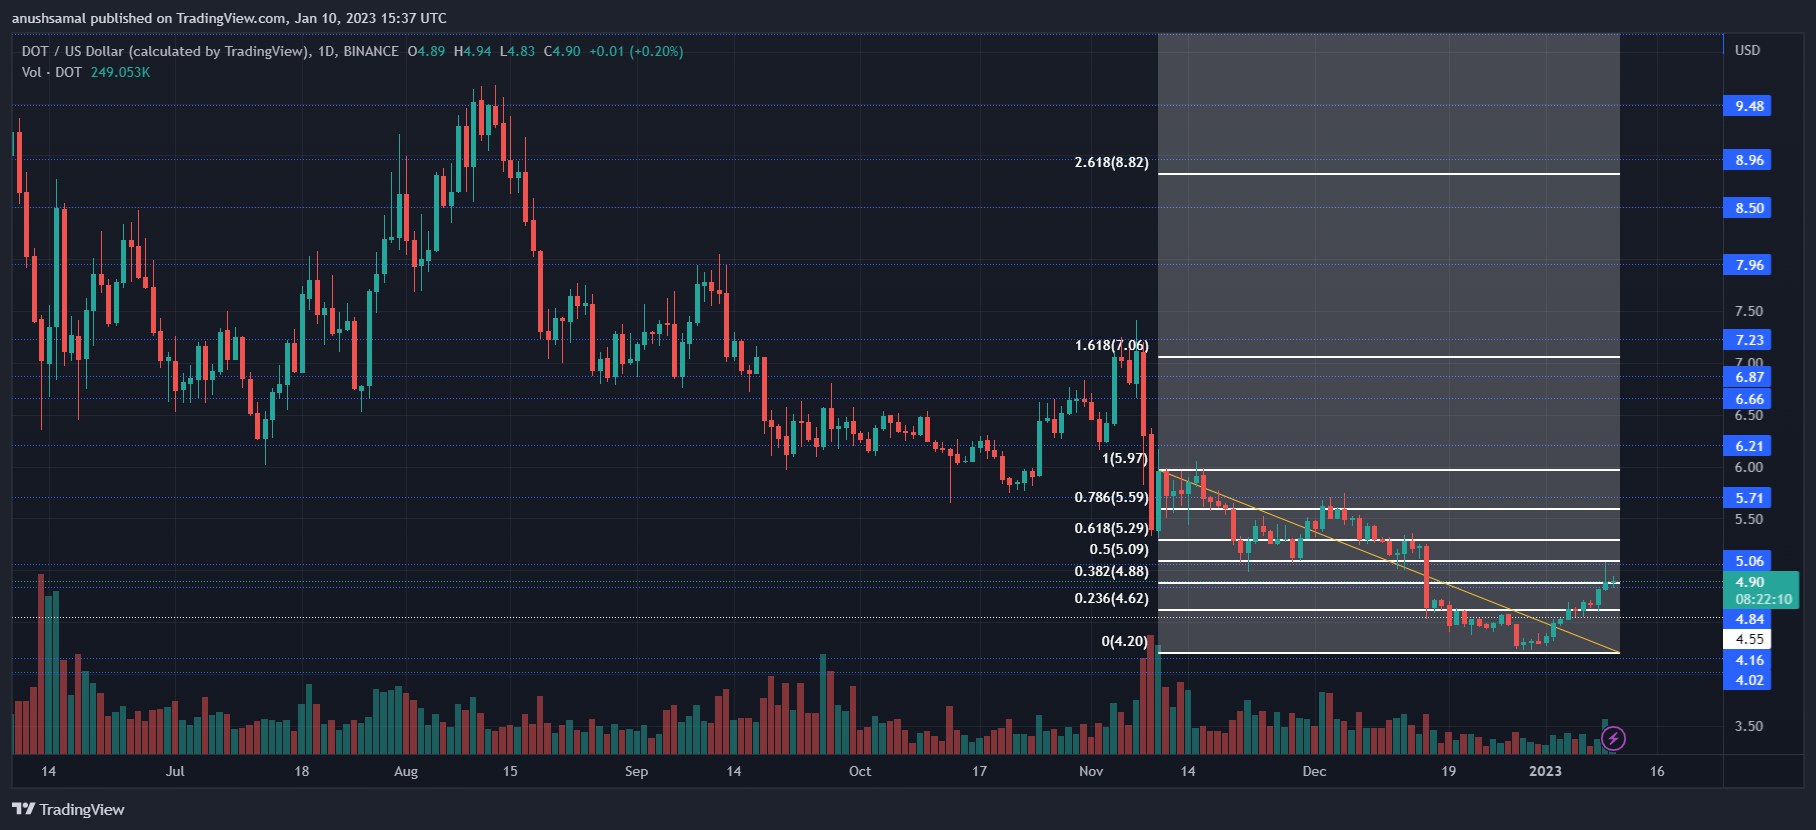
DOT is trading at $4.90 at press time. The $4.90 price level is a strong resistance point for the altcoin. Although DOT was able to break through the $4.80 resistance level, which has proven to be a tough resistance sign in the past, the coin remains below the $5 level.
The $5 mark is very important, because the 78.6% Fibonacci retracement level is also present wherever the coin meets the mark. A push above $5 will take the coin above $5.20.
On the other hand, one bearish push and DOT will land at $4.40 and then $4.16. The number of DOTs traded in the last session fell slightly, reflecting a small decline in buying power.
Technical Analysis
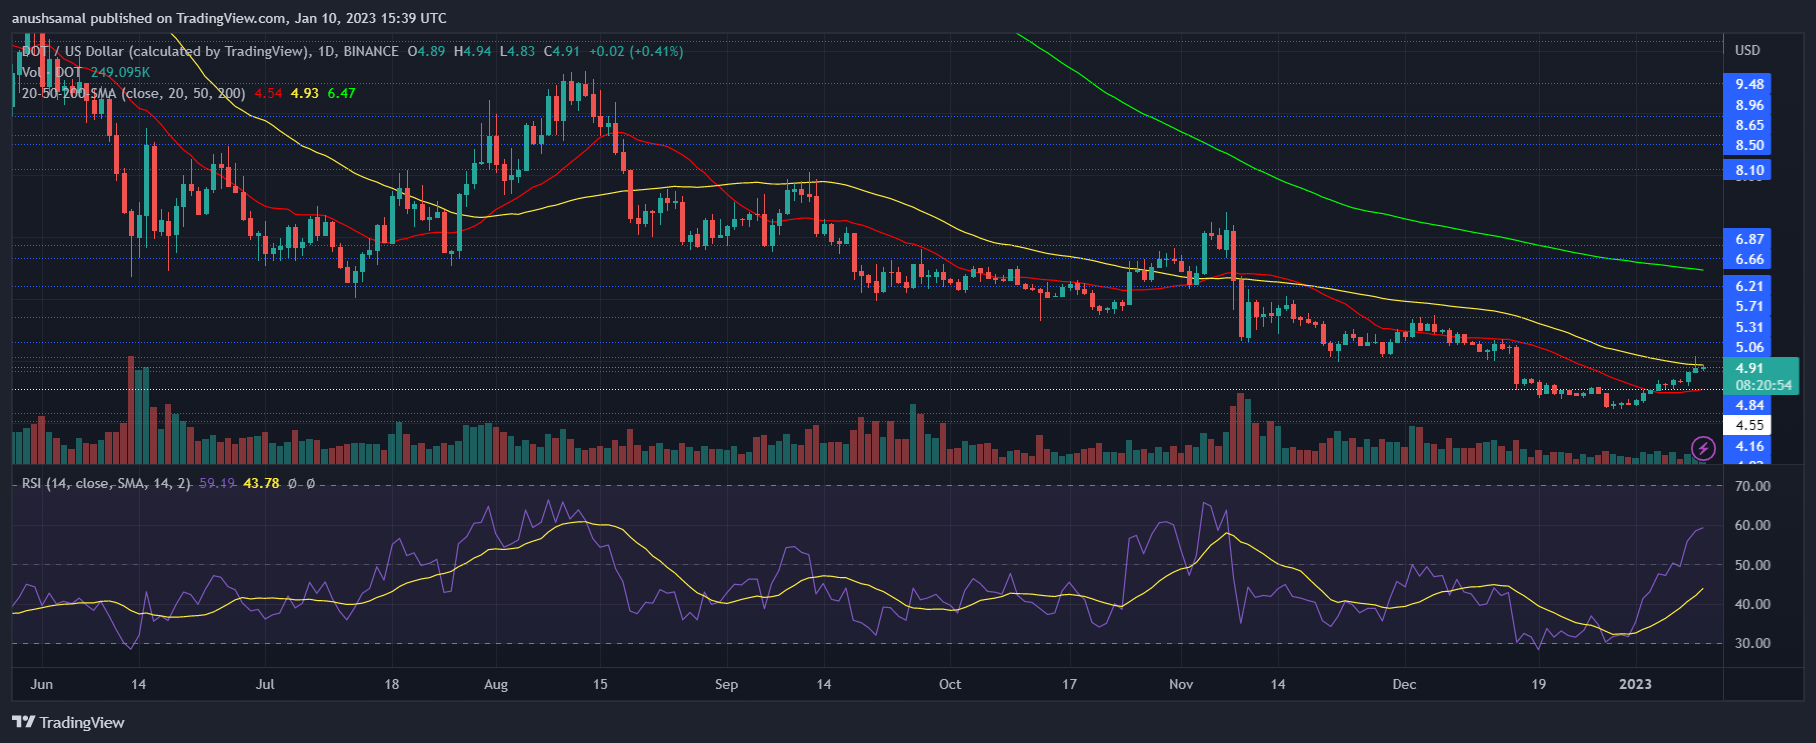
The DOT made a significant recovery in buying pressure over the past week. The Relative Strength Index shot above the 60 mark, which indicates the bullishness of the chart.
Additionally, asset prices moved above the 20-Simple Moving Average (SMA) line, which means buyers are driving price momentum in the market.
Polkadot is also very close to the 50-SMA line, and only a slight push from buyers will help the price go down. A move above the 50-SMA will cause another significant rally for Polkadot.
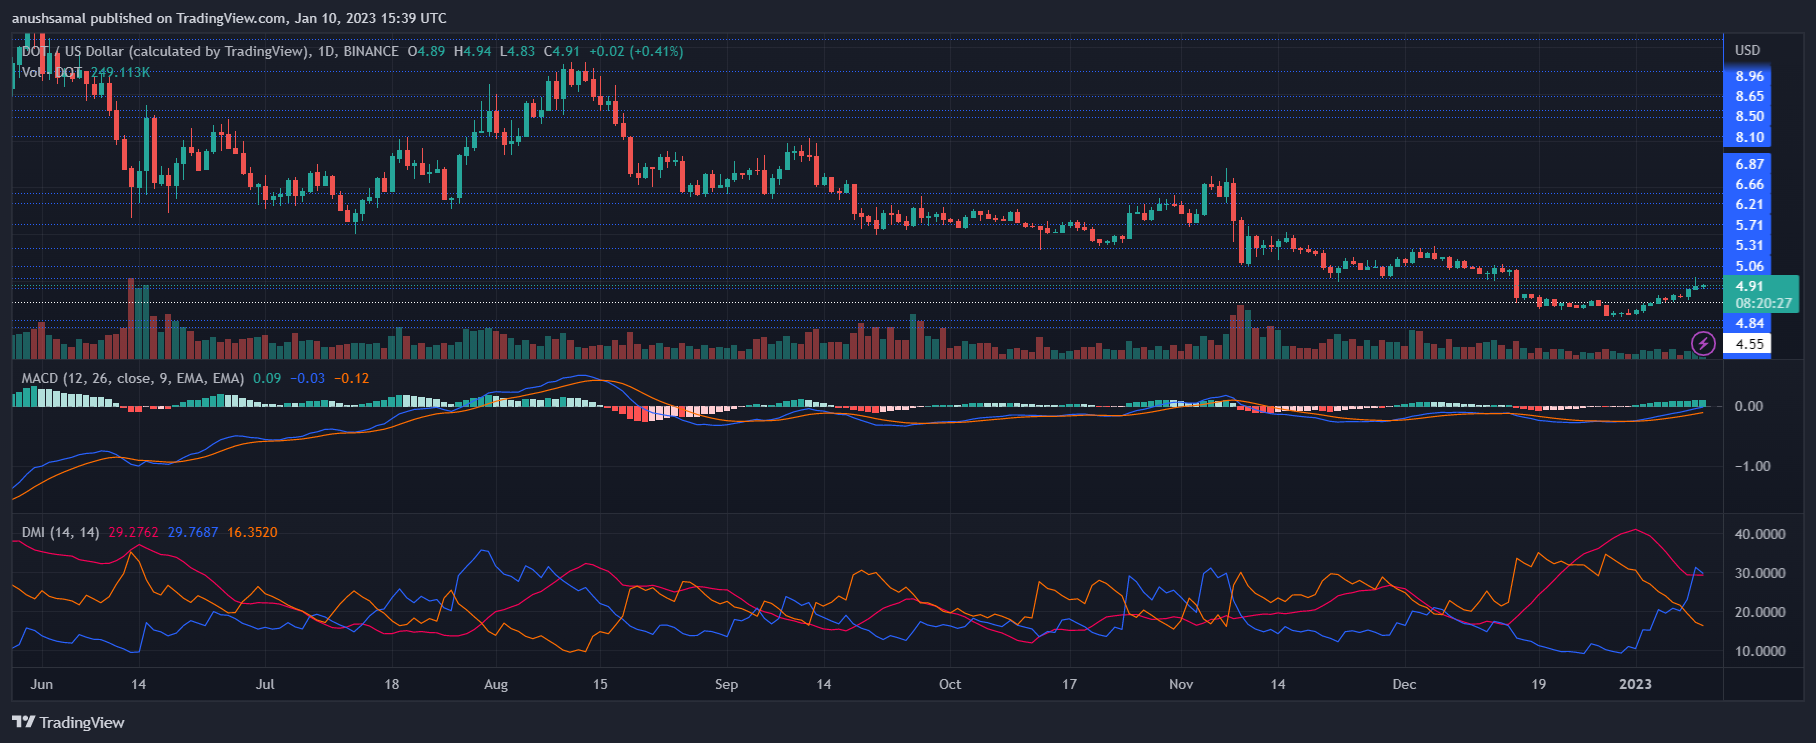
After demand increases, technical indicators show a buy signal for the coin. This usually means the coin is headed up. Moving Average Convergence Divergence (MACD) shows price momentum and reversals.
Indicator painted green signal bar, which they buy signal for DOT. The Directional Movement Index is positive because the +DI (blue) line is higher than the -DI (orange) line. The Average Directional Index (red) is above 20, which indicates that price action is currently strengthening.
Featured Images From Unsplash, Graphics From TradingView.com