Data from Glassnode shows that the crypto market is currently observing capital flows at a rate of around $4.5 billion per month.
The Crypto Market Has Recently Switched From Looking Outward To Inward
According to on-chain analytics company Glassnode, the sector has only experienced outflows since April 2022 to date. The relevant indicator here is “realized cap,” which is a capitalization model that calculates the “true value” of any asset.
The model provides the value of each token in the circulating supply at the price it was last moved (as opposed to the usual market cap, which uses the same current asset price to value all coins).
To assess the flow of capital into and out of all crypto markets, Glassnode has considered the combined realization cap of Bitcoin, Ethereum, and stablecoins.
The company made the assumption that most fiat enters the inflow of the crypto sector through BTC, ETH, and stables, so only these assets are selected for the calculation.
Now, here’s a chart showing the trends in realized caps of Bitcoin, Ethereum, and stablecoins, as well as the combined amount, over the past few years:
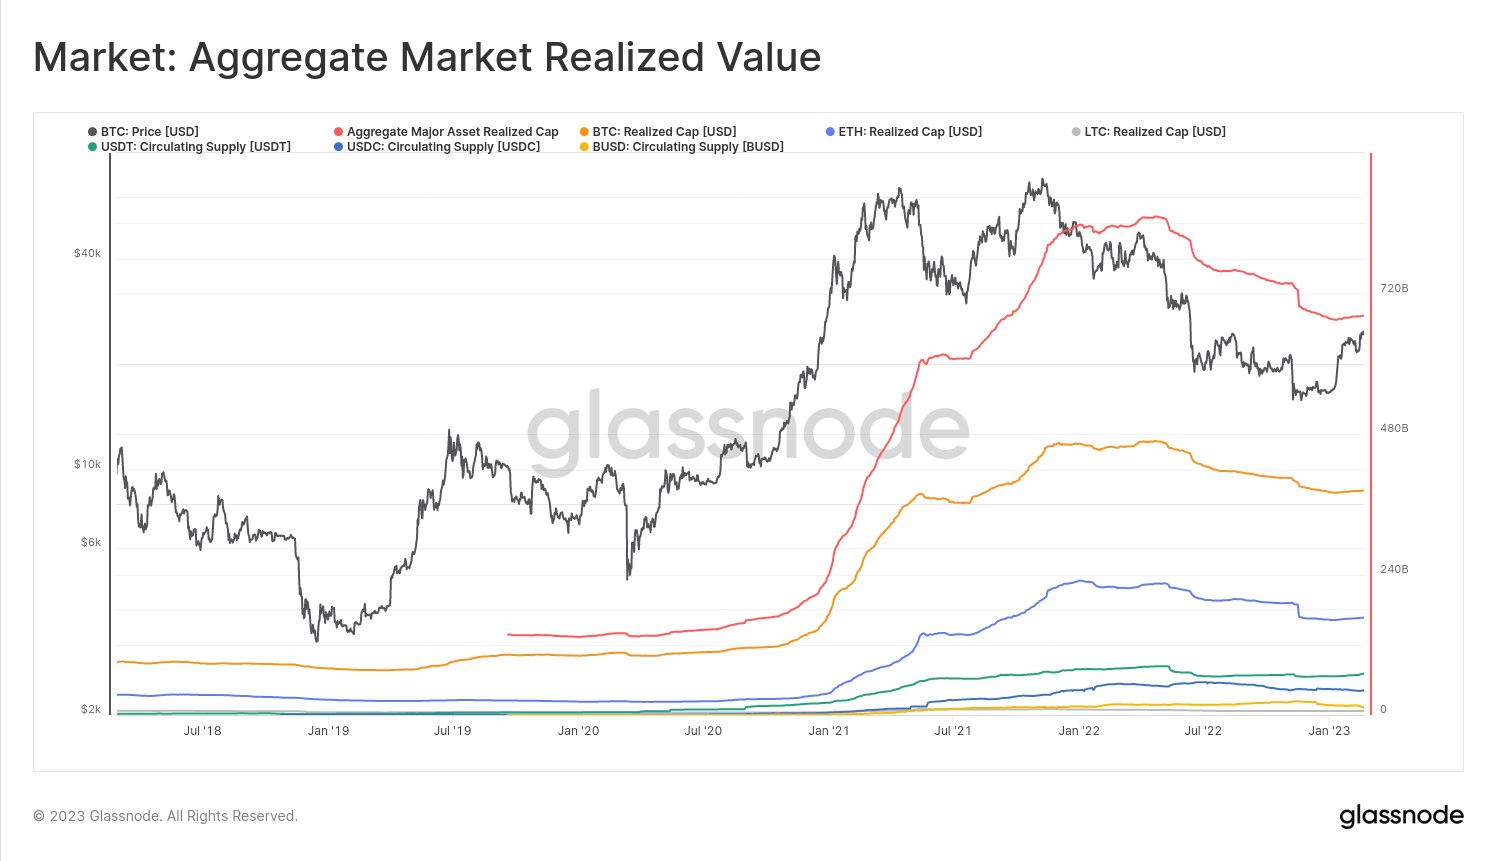
Looks like the sum of these metrics has declined in recent months | Source: Glassnode on Twitter
As shown in the chart above, the combined cap of these crypto assets has declined by a net amount in recent months. This means that there is an outflow in the market during this period.
Currently, the combined cap of Bitcoin, Ethereum, and stablecoins is about $682 billion. From the chart, it is clear that Bitcoin has contributed the highest amount to the number.
Now, below is a chart that specifically tracks the 30-day change in the aggregate realized cap of these crypto assets. That is, this metric measures the amount of monthly inflows and outflows in the realized cap.
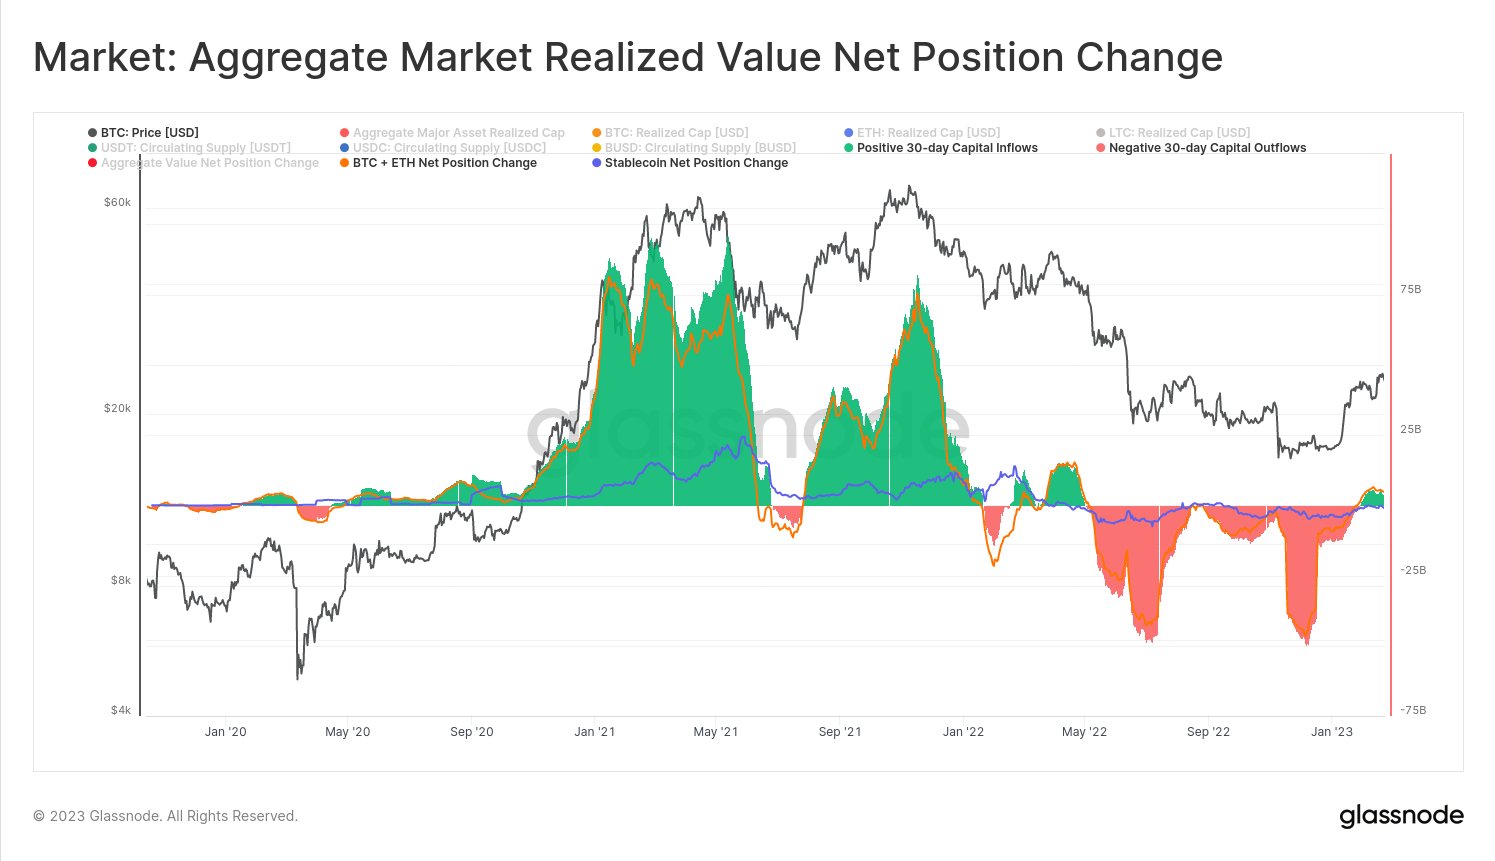
The value of the metric seems to have been positive recently | Source: Glassnode on Twitter
During most of the recent bear market, net flows in crypto markets have been negative. This means that investors have withdrawn money out of the sector (into fiat or other types of commodities) in the past year.
This trend makes sense, as historically bearish periods are when capital exits the market. Recently, however, as Bitcoin and other assets have observed a rally in their prices, the value of the indicator has become positive. At the current rate, inflows occur at the rate of $4.5 billion per month.
The chart also shows the netflow for Bitcoin + Ethereum and for stablecoins separately (shown as orange and blue colored curves, respectively). It looks like most of the new inflows are going to BTC + ETH as the stablecoins curve is relatively flat.
BTC price
At the time of writing, Bitcoin is trading around $23,800, down 2% over the past week.
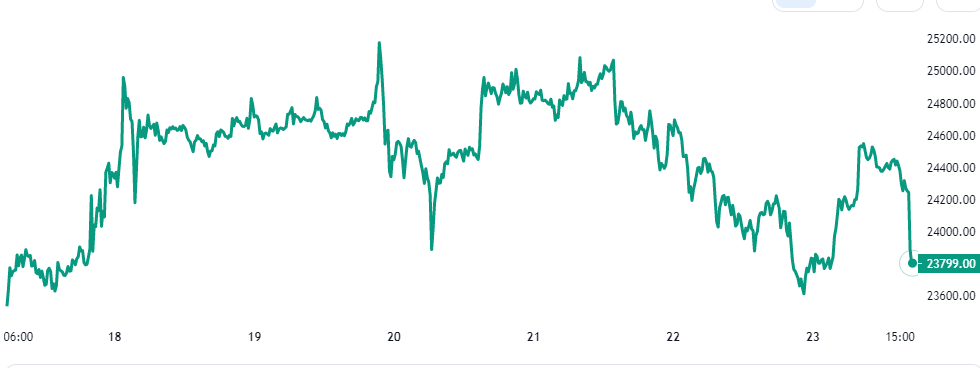
BTC continues sideways movement | Source: BTCUSD on TradingView
Featured images from Art Rachen at Unsplash.com, charts from TradingView.com, Glassnode.com