
Cardano (ADA) is currently trading at $0.2752, with a more than 65% increase in trading volume at $304.79 million. Its price change in 24 hours is +$0.006083 with a change of 2.17%. Also, the 24-hour ADA low is $0.2681, while the high is $0.27562. Its market capitalization has risen 2.25% to $9.51 billion. It is currently among the top ten cryptocurrencies, according to it CoinmarketCapin number 9.
The circulating supply is 34.52 billion ADA, with a maximum token supply set at 45 billion ADA tokens. ADA has performed well since the beginning of the year, causing optimism among holders.
With the crypto season looming in 2022, investors are hoping for better market conditions moving forward. Cardano’s recovery has reignited interest in the project and questions about how long it can sustain the rally.
What’s Behind the ADA Price Increase?
ADA enjoys adoption as trading volume increases. Investors and holders of that coin more likely to buy to the project because of its usefulness. Cardano is one of the largest blockchains that uses an energy-efficient proof-of-stake network.
This proof-of-stake helps save energy and protect the environment. The Cardano network also supports the creation of smart contracts. These smart contracts facilitate the creation of decentralized applications (DApps) on the Cardano network.
It is also getting more attention in Web3 and for game applications. With faster transaction times and regular upgrades, it is ideal for technological innovation. Cardano upgrades also undergo extensive research and scrutiny before being released to the public.
ADA price prediction
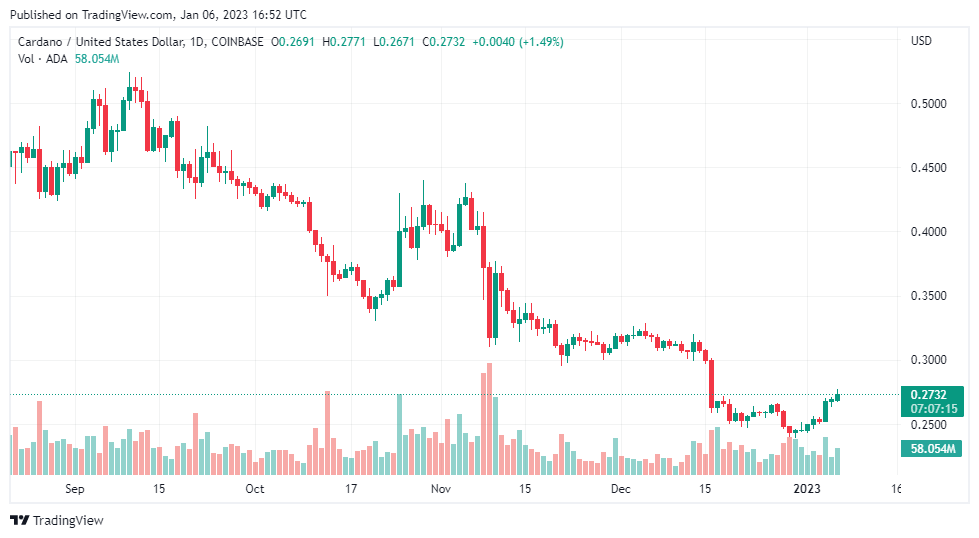
ADA trades below the 50-day and 200-day Simple Moving Average (SMA). However, the candlestick formation on the chart indicates a bullish possibility in the coming days. A thick green candle on the daily chart indicates sustained bullish pressure and is likely to continue in the coming days.
The highest value of ADA shares is 0.329 US Dollar. Other resistance levels are $0.44, $0.595, and $0.777. If the bulls hold the pressure, it will test the nearest resistance level of $0.329 in the coming days. The support levels of $0.260, $0.262, and $0.265 hold and act as a pivot for the price increase.
The Relative Strength Index (RSI) is located at 49.19, in the neutral zone above the oversold area of 40. However, the RSI will probably rise above 49 in the coming days. The Moving Average Convergence, Divergence (MACD) indicates neutrality but indicates a possible uptrend. The MACD line is below the signal line but positioned upwards.
ADA prices will increase slightly in the coming days. However, from the candlestick pattern, there are many red candles. It means that the trend can reverse at any time to a bearish pattern. Expect ADA to increase to $0.329, the nearest resistance level.
Please note that this is not investment advice. The above price prediction is the author’s analysis. Always do proper research and technical analysis. Invest the amount you can afford to lose.
Option images from Pixabay and charts from TradingView.com