Bitcoin price has been struggling below $17,000 for several weeks now, and recently dropped below the $16,900 mark. This step down in the Bitcoin chart can be attributed to the Federal Open Market Committee (FOMC) recent minutes.
The minutes of the meeting stated that the Federal Reserve System will remain with higher interest rates for the foreseeable future.
This has caused ripples through the market, causing participants to react negatively. The technical view of the asset shows a decline in accumulation, but indicators are still positive about the price of Bitcoin during the upcoming trading session. From the daily chart, it can be concluded that BTC will make a recovery in the next trading session.
Bitcoin continues to remain stable above the $16,600 price mark. Currently, these asset prices are consolidating, with major altcoins following similar price trajectories. Over the last 24 hours, BTC is down 0.6%. The price of Bitcoin is currently trading at a 76% discount from its peak in 2021. Bitcoin’s market capitalization is down slightly, indicating that sellers outnumber buyers at press time.
Bitcoin Price Analysis: One Day Chart
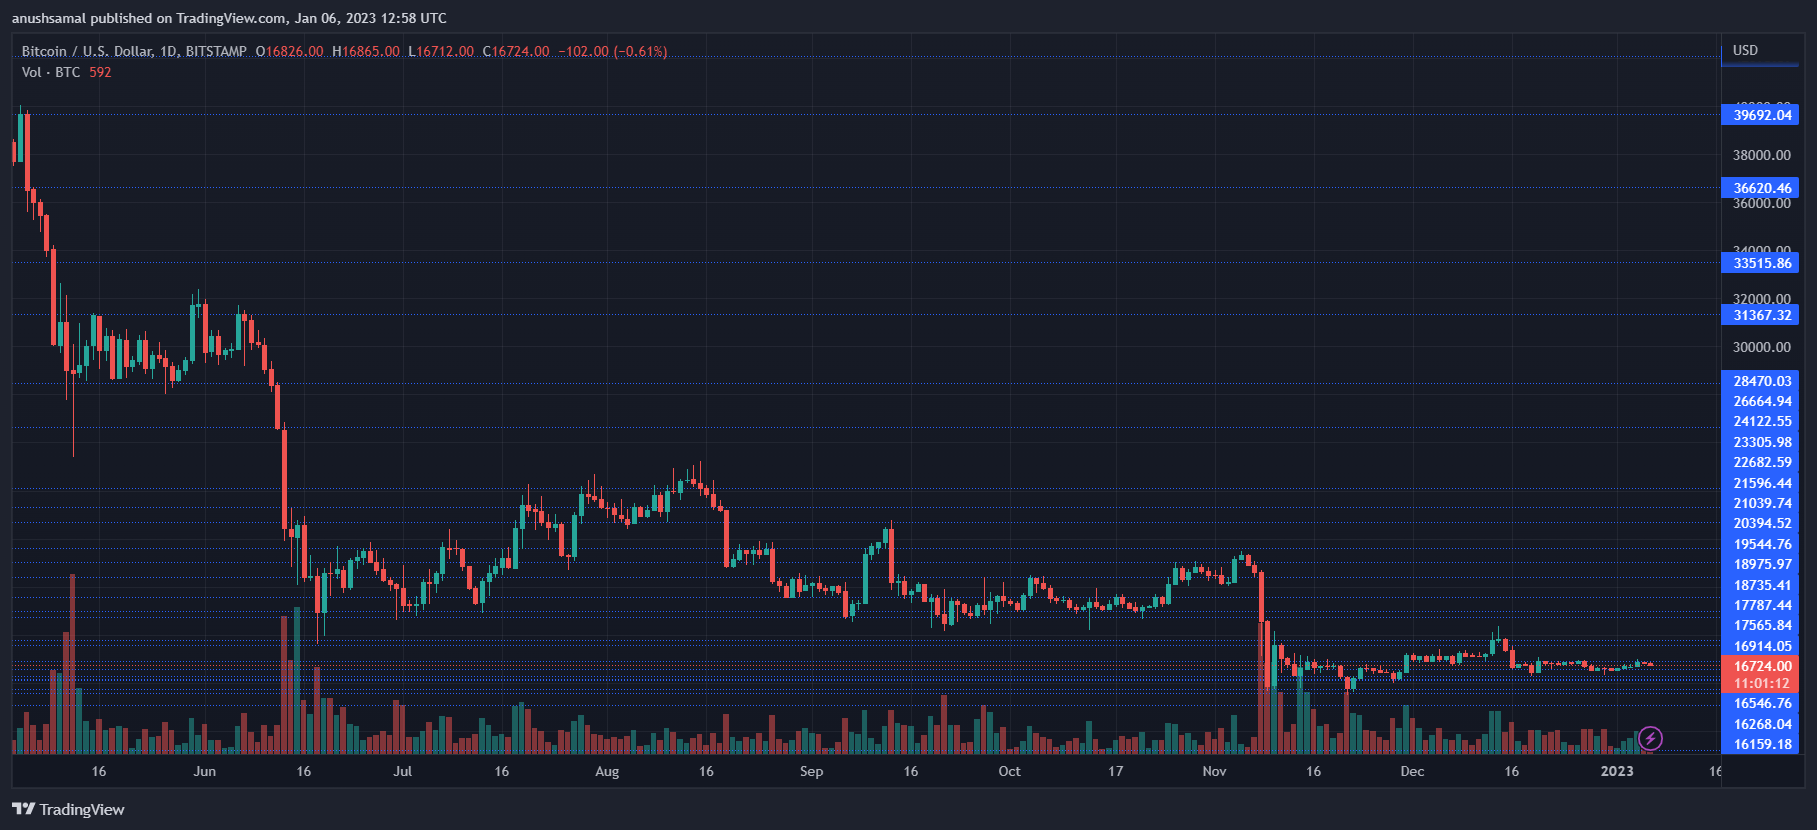
BTC is trading at $16,700 at the time of writing. The coin recently lost the $16,800 support level; However, this is extremely short-term because BTC will soon start a recovery on the chart.
A slight push from buyers will help BTC propel itself above the $16,800 mark, which indicates that the overhead resistance for the coin stands at $16,900.
Clearing the $16,900 price tag will pave the way to $17,000. On the other hand, if demand does not appear immediately, BTC could pull back to sit at $16,600 before starting to move north again. The amount of BTC traded in the last session declined to show slight bearishness.
Technical Analysis
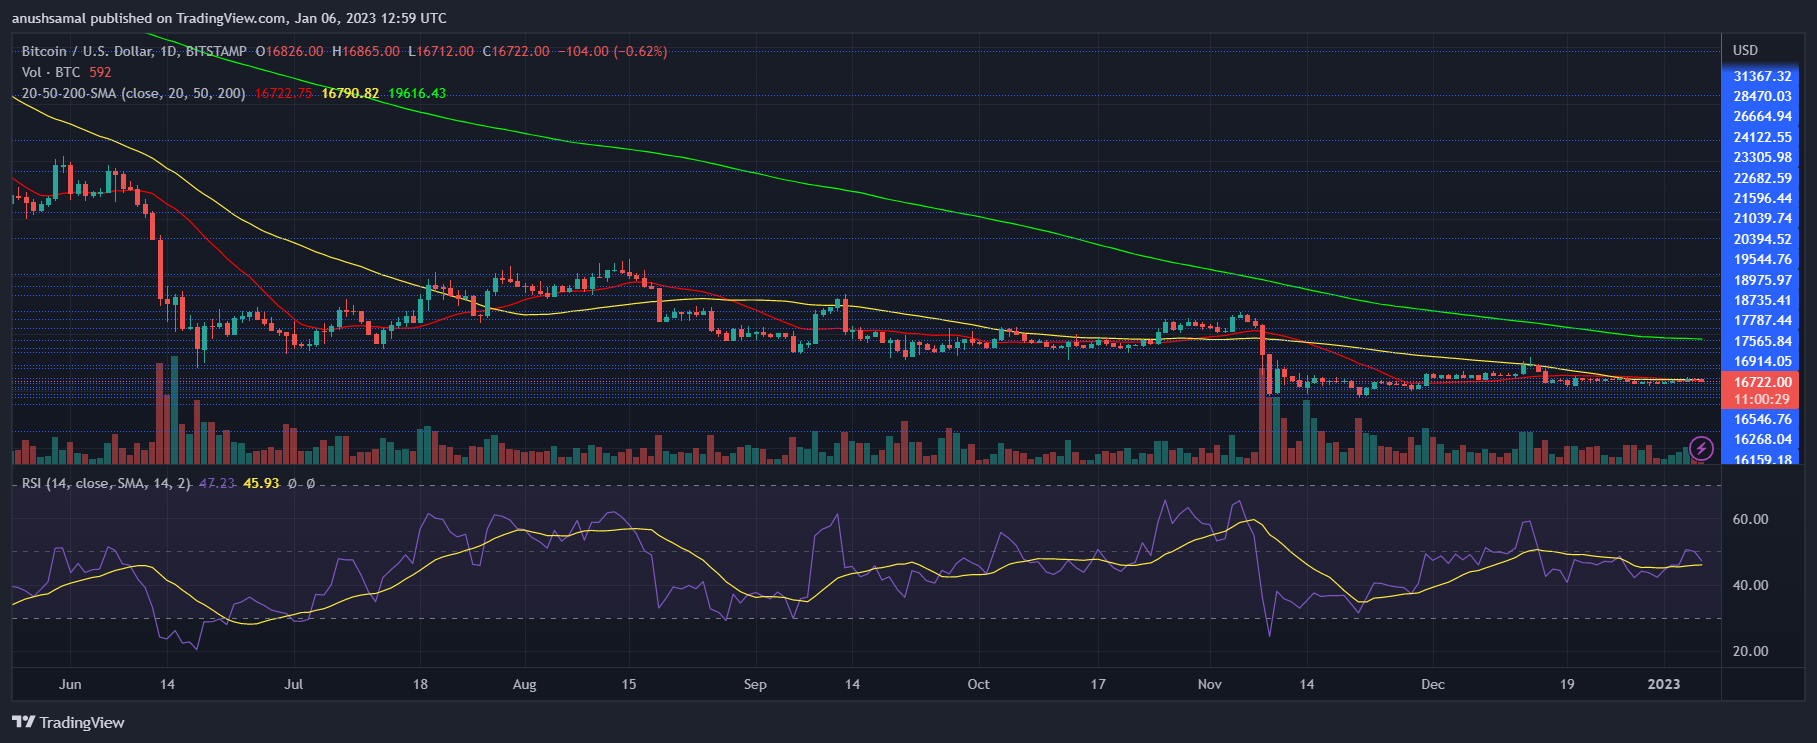
Despite the fall in the number of buyers, the technical outlook may remain positive for the price of Bitcoin. The Relative Strength Index recorded a downtick, indicating that buyers are slowly exiting the market. However, on the other hand, Bitcoin has shown positive signs on the daily chart.
The asset price is above the 20-Simple Moving Average (SMA) line, which means that buyers still have the upper hand to drive price momentum in the market. In addition, the 50-SMA (yellow) is below the 20-SMA line (red); this is a golden cross, a pattern that forms before the coin starts rallying.
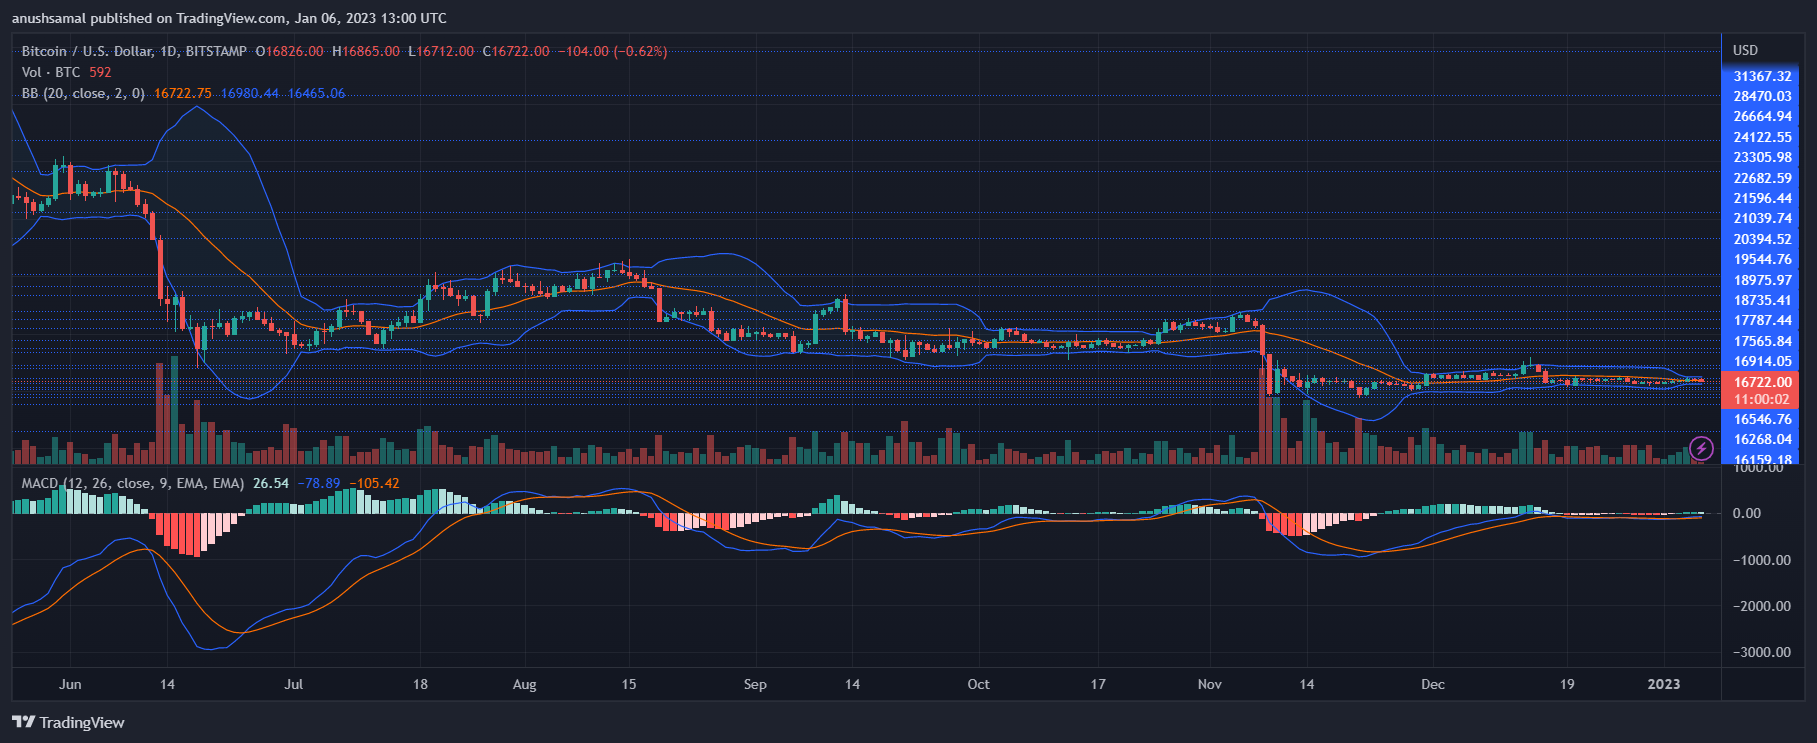
In accordance with the incoming bullish strength, the price of Bitcoin reflects a buy signal on the daily chart. Price momentum is indicated by the Moving Average Convergence Divergence, which shows a green signal bar.
Related reading: Ethereum Gains 4.5% on Weekly Timescale As Shanghai Upgrade Nears
This bar is a buy signal, which is also in line with the idea that the price of the asset will rise. Bollinger Bands represent future volatility and price fluctuations. These bands are highly sought after, very quickly, showing clear prices and possible trading opportunities for traders.
Featured Images From UnSplash, Graphics From TradingView