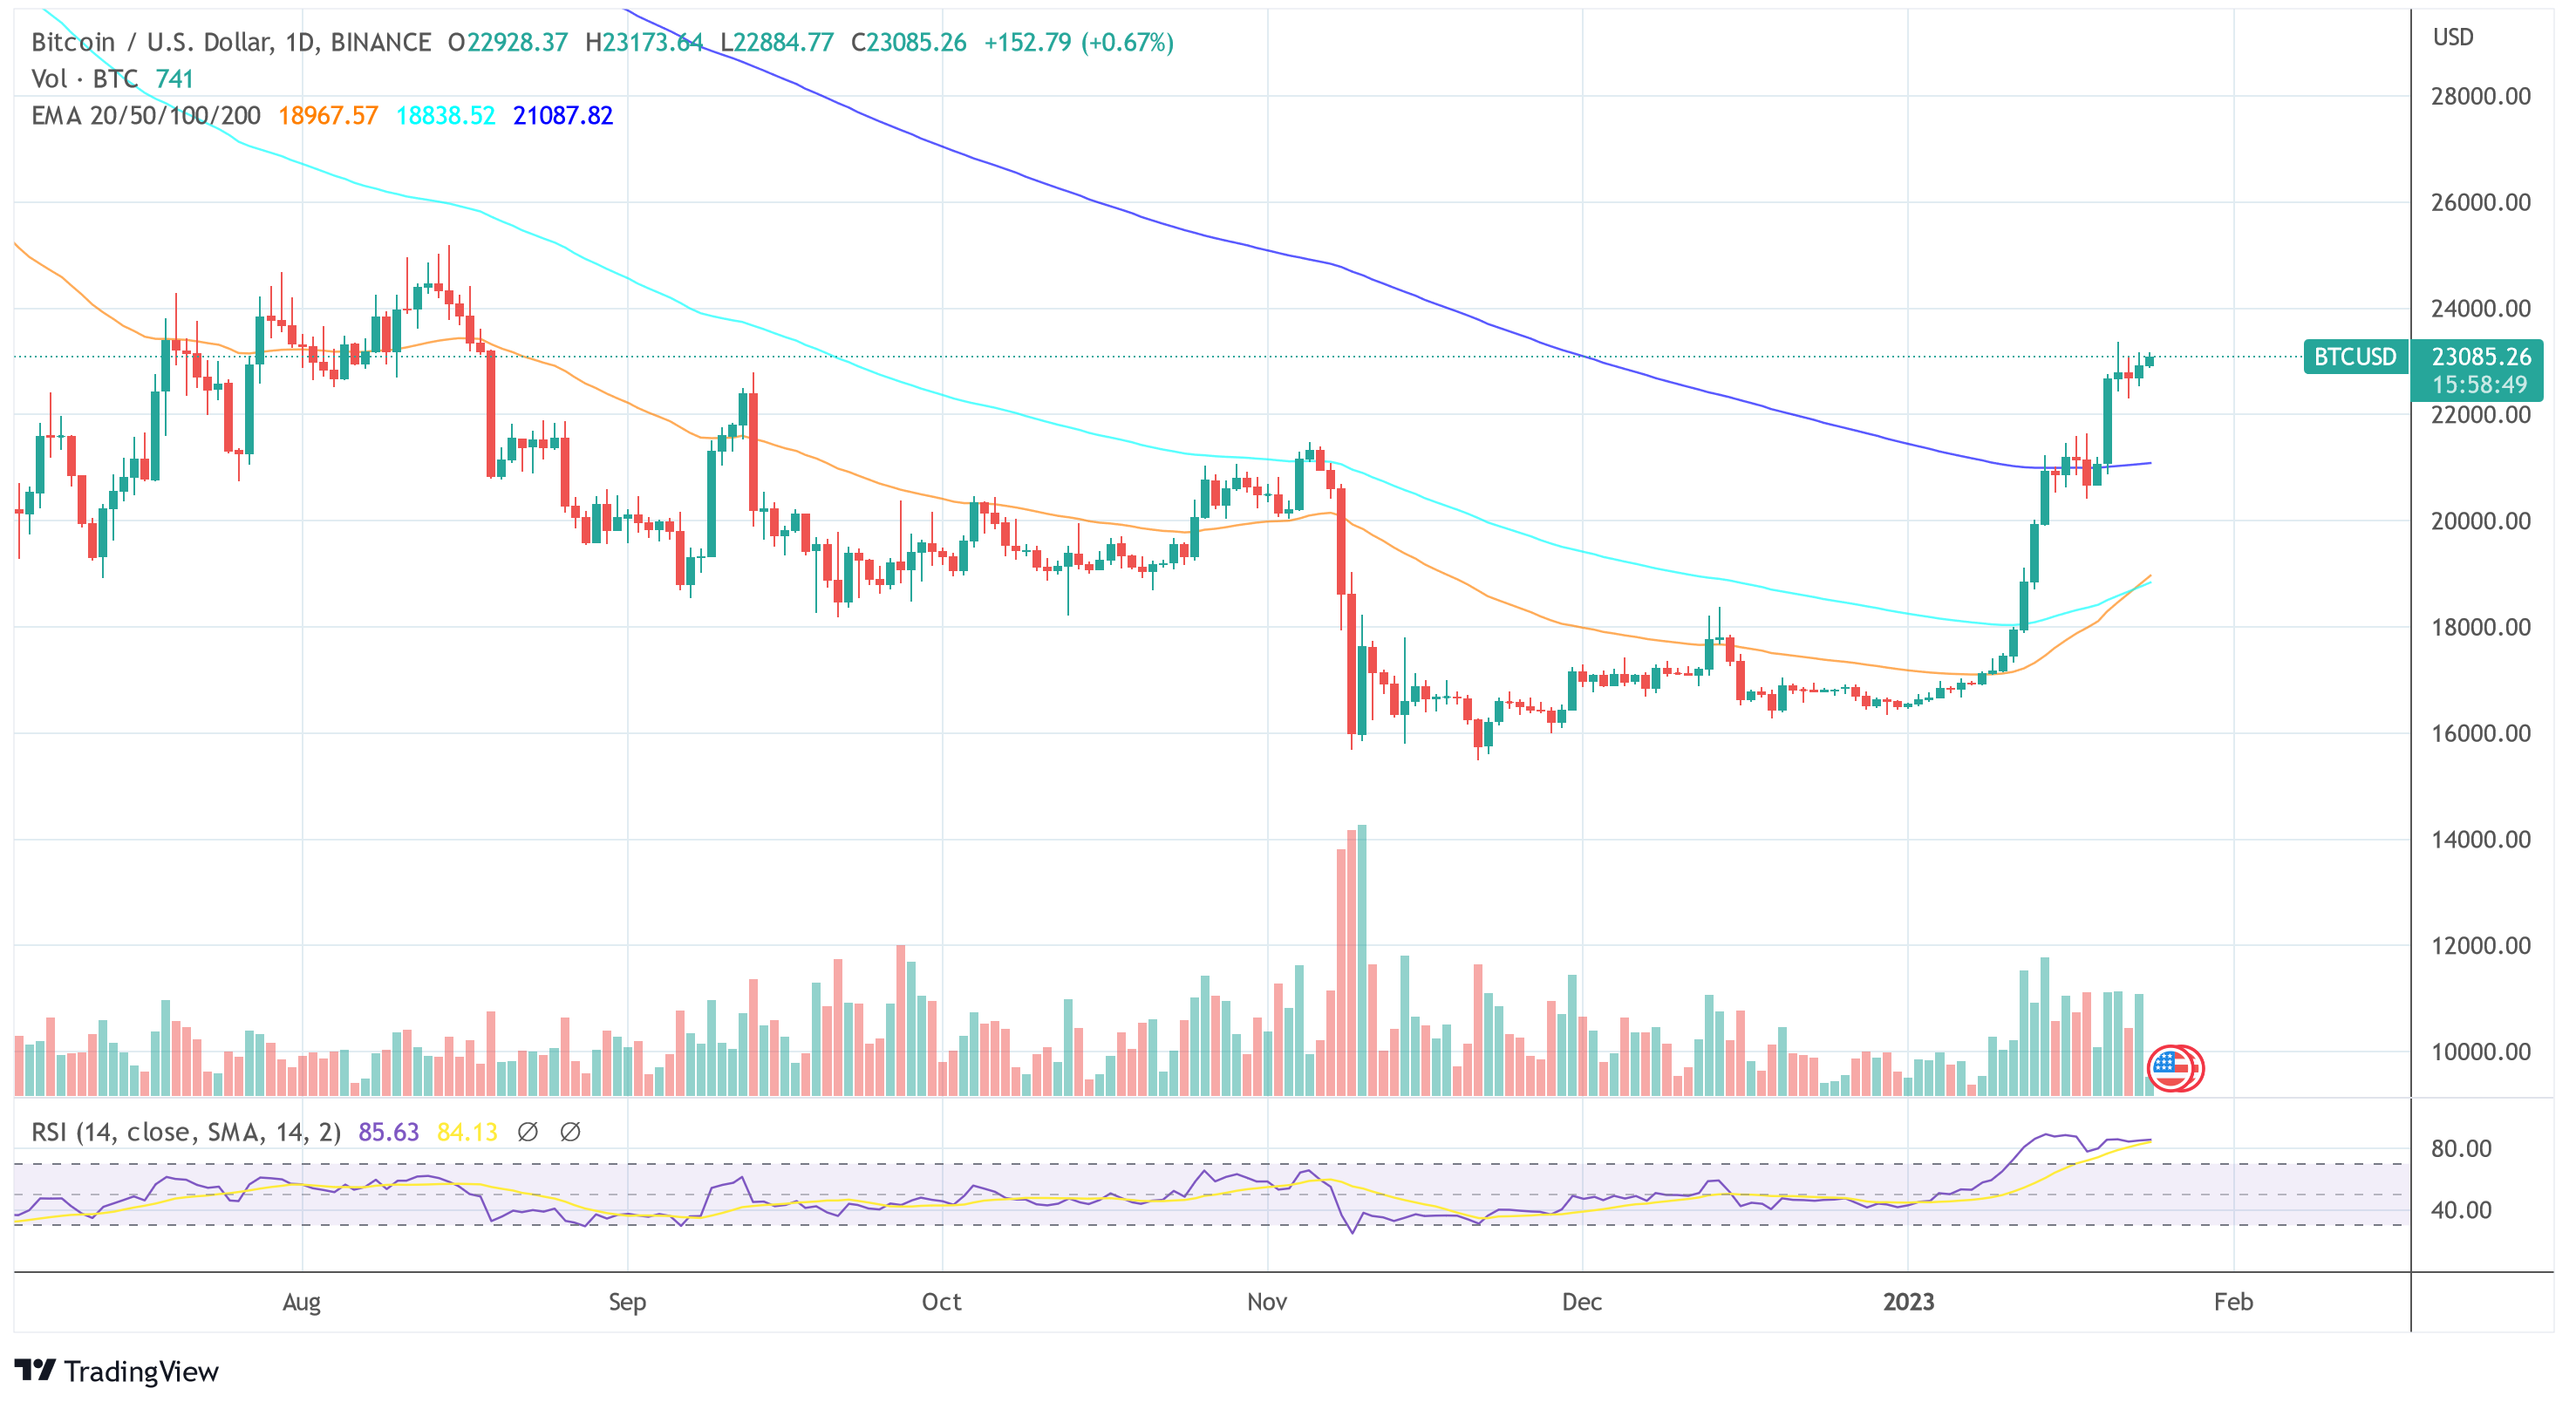
Bitcoin price is up 40% year-to-date (YTD) and has reclaimed the $23,000 level. However, with ongoing concerns about DCG and Grayscale as well as macroeconomic uncertainty, many investors are skeptical about the sustainability of the recent price rally.
With higher prices, the motivation among investors may increase to use current price levels to exit and gain liquidity, especially after a long and painful bear market in 2022, as Glassnode discussed in the report.
The famous on-chain analysis company examines in its latest research whether the recent Bitcoin bounce above the price last seen before the collapse of FTX is a bull trap or if there is a new bull on the horizon.
Bitcoin On-Chain-Data Suggests
Glassnode noted in its report that the recent price surge in the region of $21,000-$23,000 has led to the reclamation of some on-chain price models, which historically means “a psychological shift in the behavior pattern of holders.”
The company reviewed the Investor price and the Delta price, noting that in the 2018-2019 bear market, the price remained within the Investor-Delta price band limit for the same period (78 days) as it is now (76 days).
“This suggests a painful equanimity in the darkest phase of a bear market,” Glassnodes said.
In addition to the duration component of the bottoming phase, Glassnode also shows the compression of the investor’s delta price range as an indicator of the intensity of market undervaluation. “Considering the current price and compression value, the same confirmation signal will be triggered when the market price recovers to $28.3k.”
Regarding the sustainability of the current move, the analysis notes that the recent rally was accompanied by an increase in the percentage of supply in profits, rising from 55% to more than 67%.
This sudden increase in 14 days is one of the strongest changes in profitability compared to the previous bear market (+ 10.6% in 2015 and 8.3% in 2019), which is a bullish signal for Bitcoin.
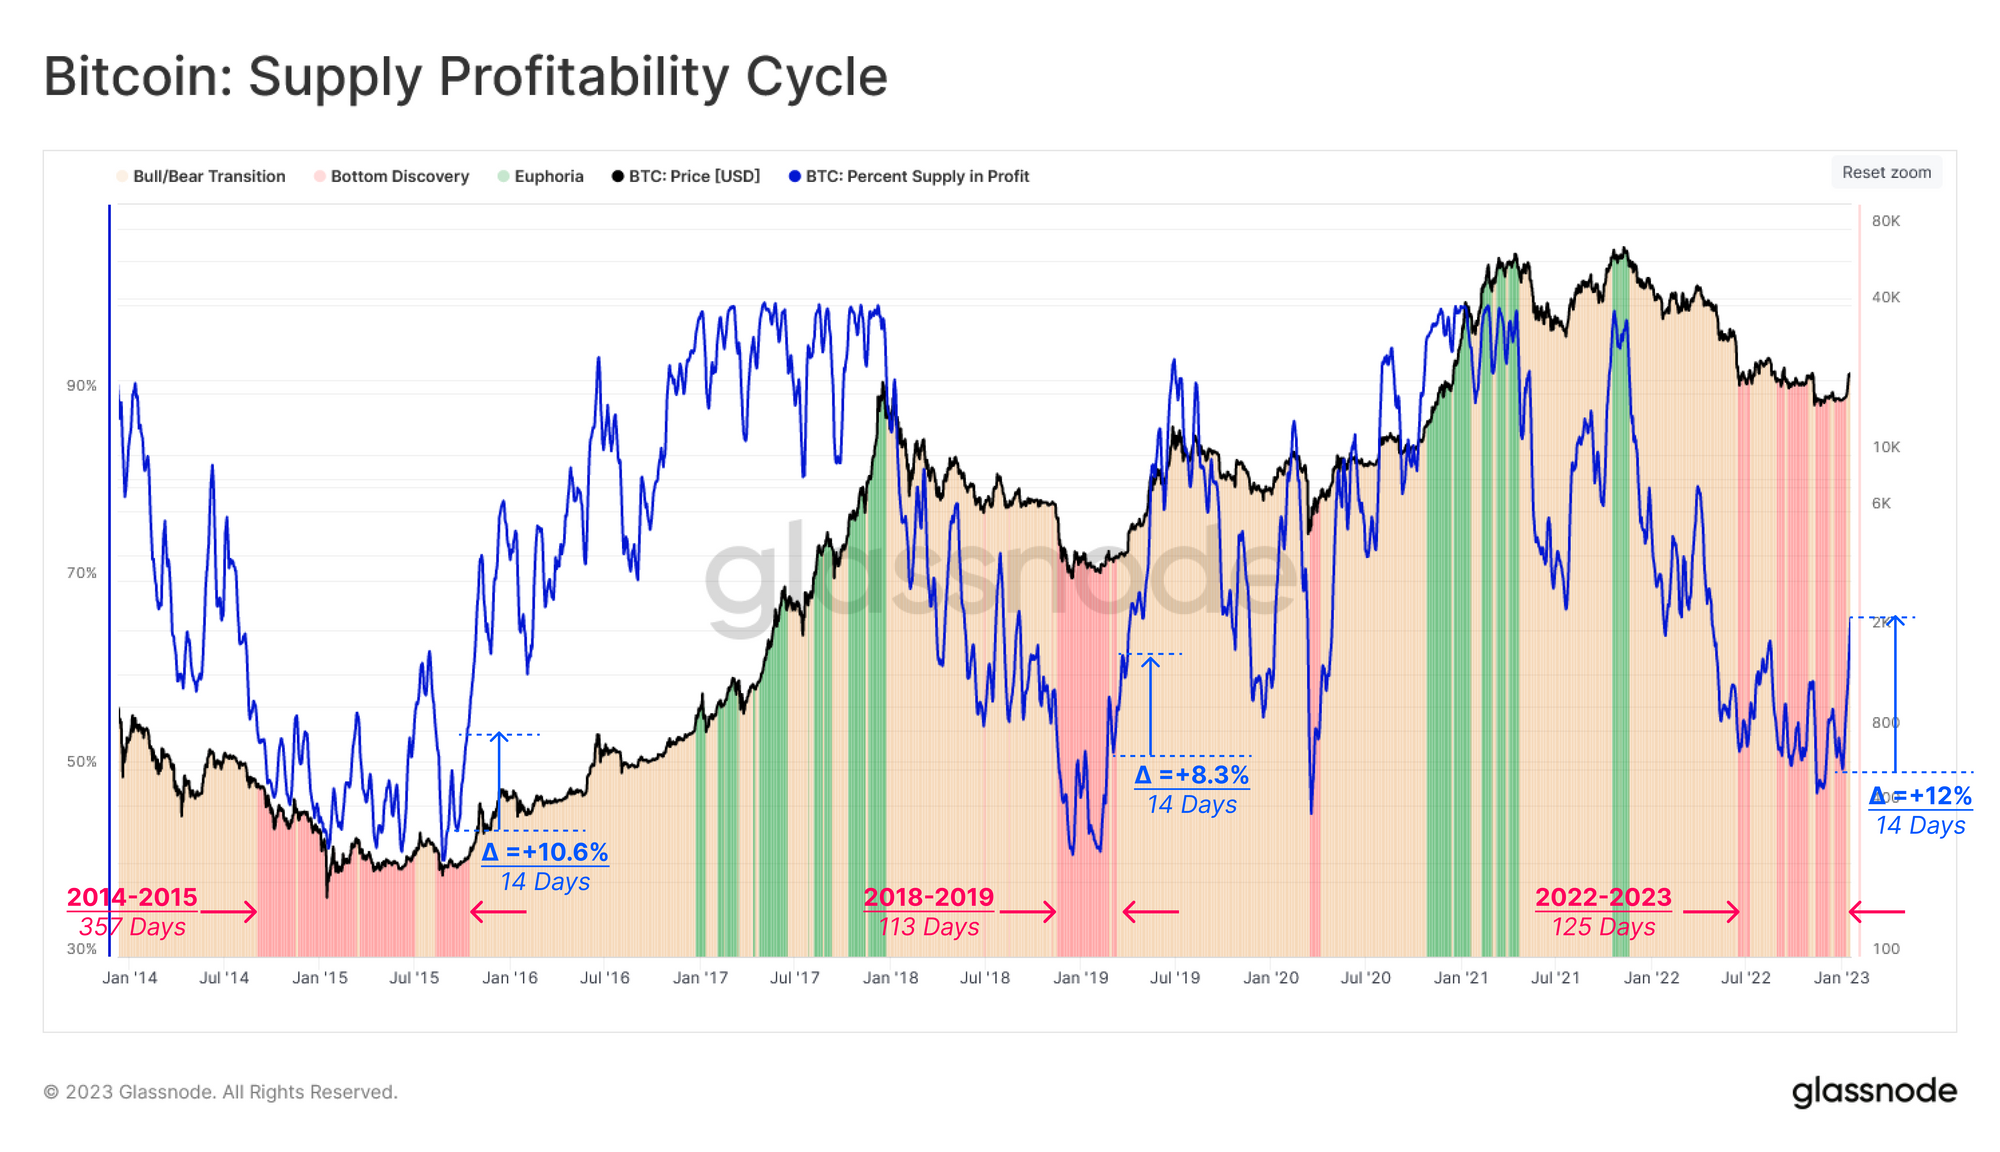
After the capitulation event last year, when the majority of investors were pushed into losses, the market has now transitioned to a “regime of profit dominance,” which Glassnode said is a “promising sign of healing, after strong deleveraging pressure in the second half of 2022.”
However, what is less bullish is the selling pressure from short-term holders of Bitcoin (STH), traditionally “an influential factor in the formation of a local recovery (or correction) pivot.” The recent surge has pushed this metric above 97.5% in first gains since the November 2021 peak, increasing the likelihood of selling pressure from STH.
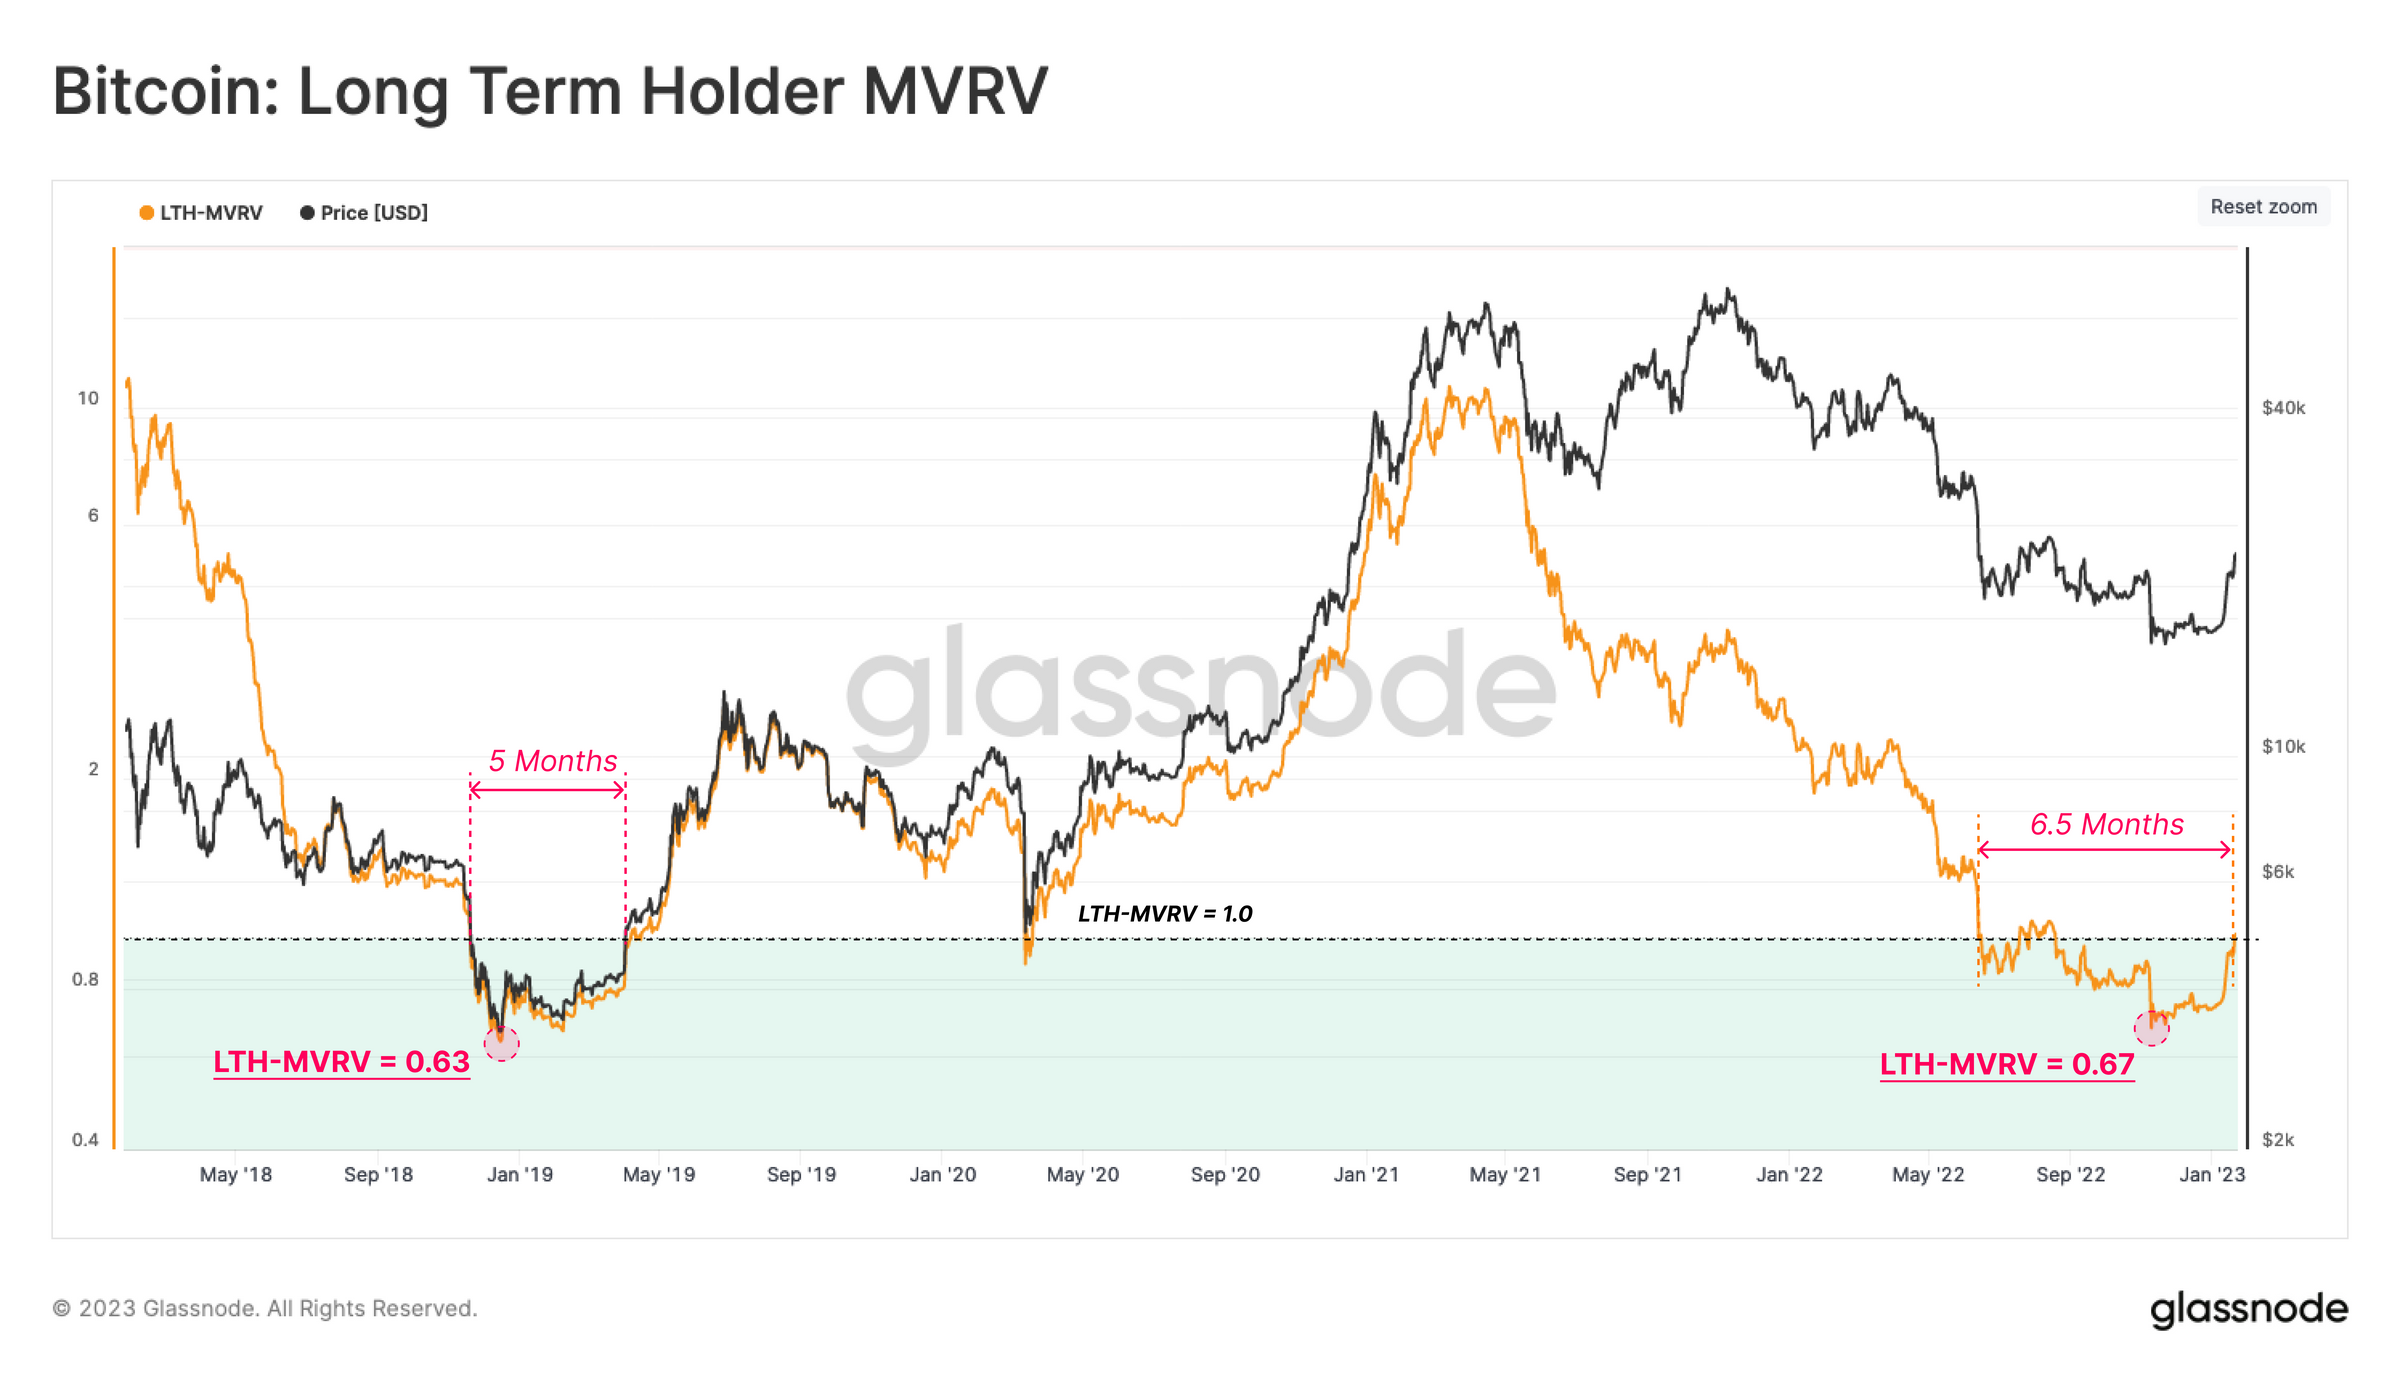
Long-term Bitcoin holders (LTHs) have once again risen above their cost basis at the current price after 6.5 months, which is $22,600. This means that the current LTH average is just above the breakeven base. Indeed, the current trend shows that the following can be in:
Considering the length of time LTH-MVRV has been trading below 1 and the lowest print value, the remaining bear market is comparable to 2018-2019 so far.
Glassnode also stated that the volume of coins older than 6 months has increased by 301,000 BTC since the beginning of December, proving the strength of the HODLing belief.
On the other hand, miners are using the recent price surge to boost their balance sheets. Miners have spent about 5,600 BTC more than they received since January 8th.
In conclusion, the research firm says it is not yet able to make a final decision on whether the next bull market is near or whether the bulls have entered a trap:
[H]higher prices and the lure of earnings after a prolonged bear market motivate the source to become liquid again. […] On the contrary, the supply held by long-term holders continues to increase, which can be considered a signal of strength and confidence. […].
At press time, the price of Bitcoin stood at $23,085, remaining relatively calm after the recent spike.
Featured images from iStock, Charts from Glassnode and TradingView.com