[ad_1]
AlphaStreet Newsdesk powered by AlphaStreet Intelligence
Stock $213.69 (+2.9%)
EPS YoY -6.8%|Rev YoY +4.7%|Net Margin 3.4%
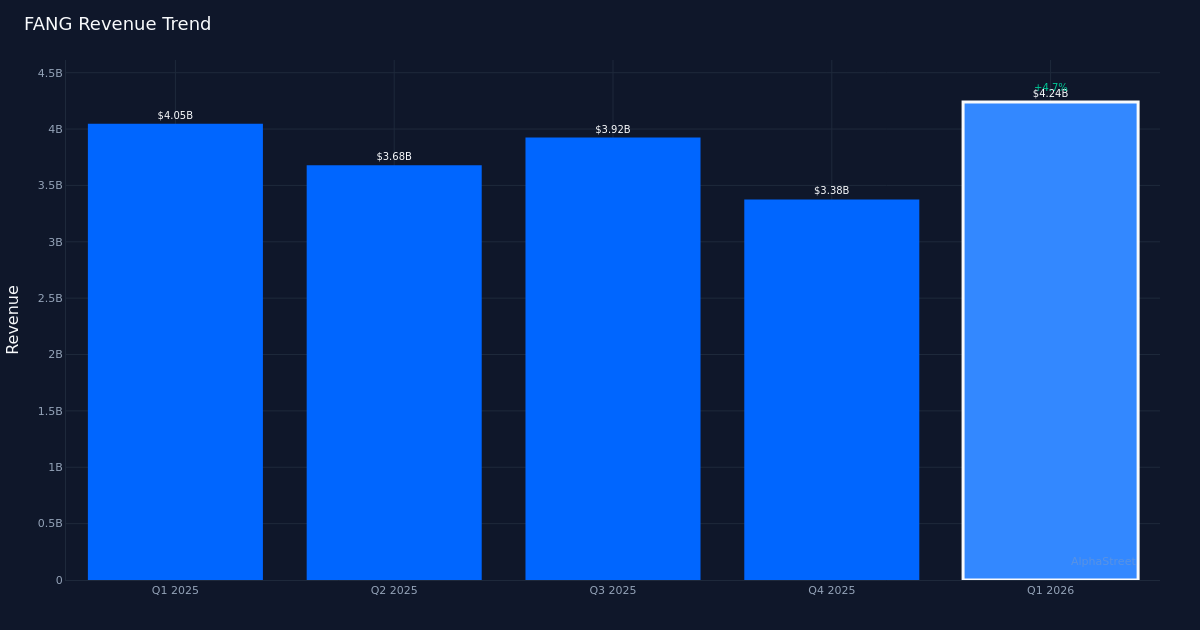
Diamondback Energy delivered a decisive earnings beat in Q1 2026, exceeding analyst expectations by 25.5% with adjusted EPS of $4.23 versus the $3.37 consensus. The outperformance drove shares up 2.9% to $213.69, though the headline beat masks a more complex earnings quality story lurking beneath the surface. While the company generated $4.24B in revenue—a 4.7% year-over-year increase from $4.05B—the dramatic compression in profitability metrics reveals this was fundamentally a different type of quarter than the prior year period.
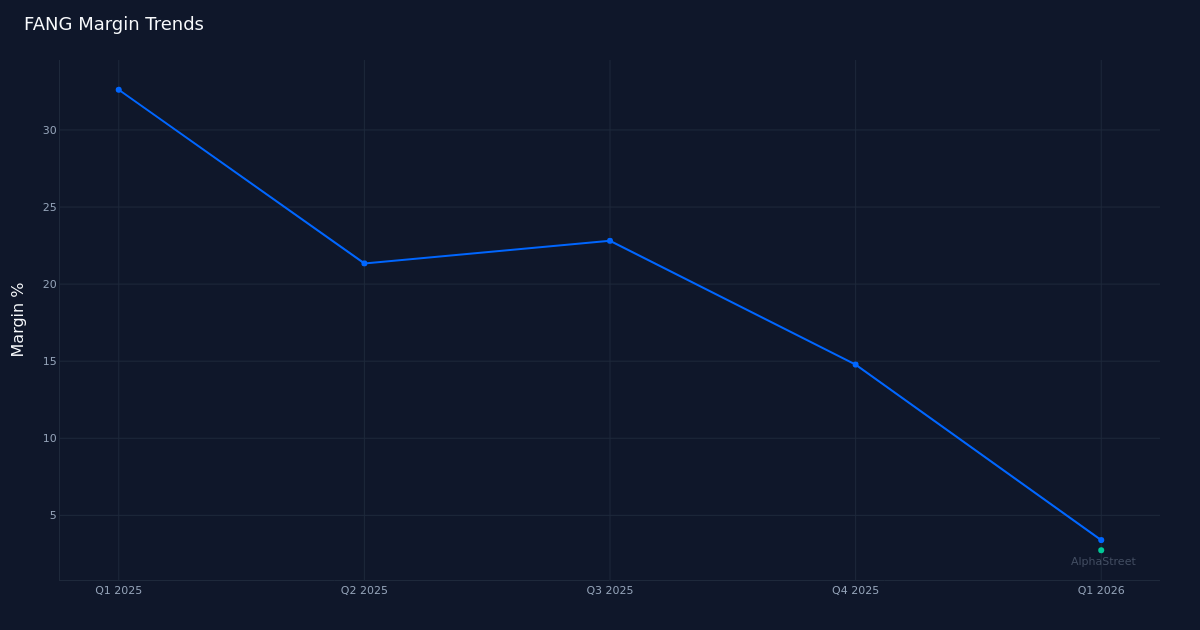
The most striking feature of these results is the severe margin deterioration, which transforms the narrative from operational strength to earnings quality concerns. Net margin collapsed to 3.4% from 32.6% in Q1 2025, a contraction of 29.2 percentage points that reduced net income to $144.0M from $1.32B year-over-year. Operating margin compressed to 2.7% with operating income of just $116.0M. This simultaneous occurrence of revenue growth and margin compression indicates the company is generating top-line expansion at the expense of profitability—a pattern that typically signals deteriorating pricing power, rising input costs, or operational inefficiencies that offset volume gains. The fact that revenue grew 4.7% while net income cratered 89% demonstrates how completely margin structure has been reshaped.
The sequential revenue trajectory shows meaningful volatility that complicates any attempt to establish a sustainable growth narrative. Q1 2026 revenue of $4.24B represents a sharp rebound from Q4 2025’s $3.38B, but this follows an irregular pattern across recent quarters: $3.92B in Q3 2025 and $3.68B in Q2 2025. This mixed trend suggests quarter-to-quarter results are being driven more by production timing, commodity price fluctuations, or one-time factors rather than steady operational momentum. The sequential earnings pattern is equally erratic, with Q1’s $4.23 EPS surging from Q4’s $1.74, but remaining below the $4.54 posted in the year-ago quarter—a 6.8% decline that underscores the company’s struggle to grow bottom-line profitability despite revenue gains.
Cash generation metrics provide the sole bright spot in an otherwise challenging profitability picture. Operating cash flow of $1.83B and free cash flow of $1.71B demonstrate the company’s ability to convert revenue into cash despite the compressed margins, with EBITDA reaching $3.00B. This cash generation capability is particularly important given management’s capital allocation priorities, as evidenced by their disclosure: “We bought back 42 million shares for $6 billion to date at $148 a share.” The magnitude of this buyback—executed at a price substantially below the current $213.69 share price—represents a significant value creation opportunity if the company can stabilize margins while maintaining production levels of 521.0MBO/d oil production.
Management’s commentary during the earnings call was notably sparse on operational detail, focusing instead on procedural elements. The transcript quotes provided minimal strategic insight, with management noting “The reconciliations with the appropriate GAAP measures can be found in our earnings release issued yesterday afternoon” and procedural guidance that “To ask a question during the session, you will need to press star 11 on your telephone.” The one substantive comment addressed portfolio management: “Just because you did sell some in the quarter but still own 39%, the company’s free cash flow outlook’s obviously stronger, so less need for divestitures.” This suggests a strategic shift toward organic cash generation rather than asset monetization, which should provide more earnings stability if margins can recover.
The 100% beat rate over the most recent quarter provides limited insight given the small sample size, though the 25.5% magnitude of the beat suggests either conservative guidance or positive developments late in the quarter. The combination of beating expectations while posting year-over-year EPS declines of 6.8% indicates analysts had appropriately lowered the bar heading into the quarter. This dynamic raises questions about whether the beat represents genuine operational outperformance or simply reflects reduced expectations following the margin compression visible in prior quarters.
The stock’s 2.9% post-earnings gain appears modest given the 25.5% earnings beat, suggesting investors are focused on the underlying margin deterioration rather than the headline surprise. Trading at $213.69, shares have recovered substantially from the $148 average buyback price management cited, providing validation for the capital allocation strategy. However, the muted price reaction to a significant earnings beat typically indicates skepticism about sustainability—investors appear concerned whether the company can maintain this earnings trajectory given the margin pressures and sequential volatility evident in recent quarters.
The energy sector context is critical for interpreting these results, as commodity price volatility can create the exact pattern observed here: revenue growth with margin compression if realized prices lag cost inflation. The total oil production figure of 979 combined with the 521.0MBO/d production rate provides scale context, though the relationship between production volumes and revenue growth of 4.7% suggests either pricing headwinds or unfavorable production mix shifts. For an E&P operator, maintaining production while improving capital efficiency should drive margin expansion—the opposite of what occurred this quarter.
What to Watch: The critical question for Q2 is whether the severe margin compression proves temporary or structural. Monitor whether operating margin can recover from the 2.7% level as any sustainable investment thesis requires margin expansion alongside revenue growth. Track the relationship between oil production volumes and revenue to assess pricing realization. Management’s commentary on the reduced need for divestitures given stronger free cash flow suggests confidence in organic generation, making the sustainability of the $1.71B free cash flow figure essential for validating the capital return strategy. Finally, watch whether the company continues buybacks at current prices near $214 or pauses given shares now trade 45% above the $148 historical purchase price, as this will signal management’s conviction in current valuation versus future margin recovery prospects.
This content is for informational purposes only and should not be considered investment advice. AlphaStreet Intelligence analyzes financial data using AI to deliver fast and accurate market information. Human editors verify content.
[ad_2]
Source link