The price of Polygon (MATIC) has been falling over the past few weeks. During the last 24 hours, MATIC lost 4% of its value. Altcoins have also lost about 6% in the past week. Earlier in November, MATIC touched the $1.20 price mark and fell significantly.
Since the coin collapsed in November, Polygon’s price has been listed as free. With the technical outlook on the daily chart, buyers are nowhere to be found. It will be difficult for MATIC to keep itself above the immediate support level.
Polygon’s buying power should increase to stay above the local support line. Over the past month, the coin has breached several important price floors. After trading sideways for a while, MATIC lost buyers, which made the coin fall down the charts again.
For Polygon, the most important price floor is currently at $0.74. If MATIC loses its support line, the coin can register a decline of 14%. MATIC’s market capitalization has also declined over the past few weeks, reflecting bearishness for the coin. Currently, the coin is trading 74% below its peak a year ago.
MATIC Price Analysis: One Day Chart
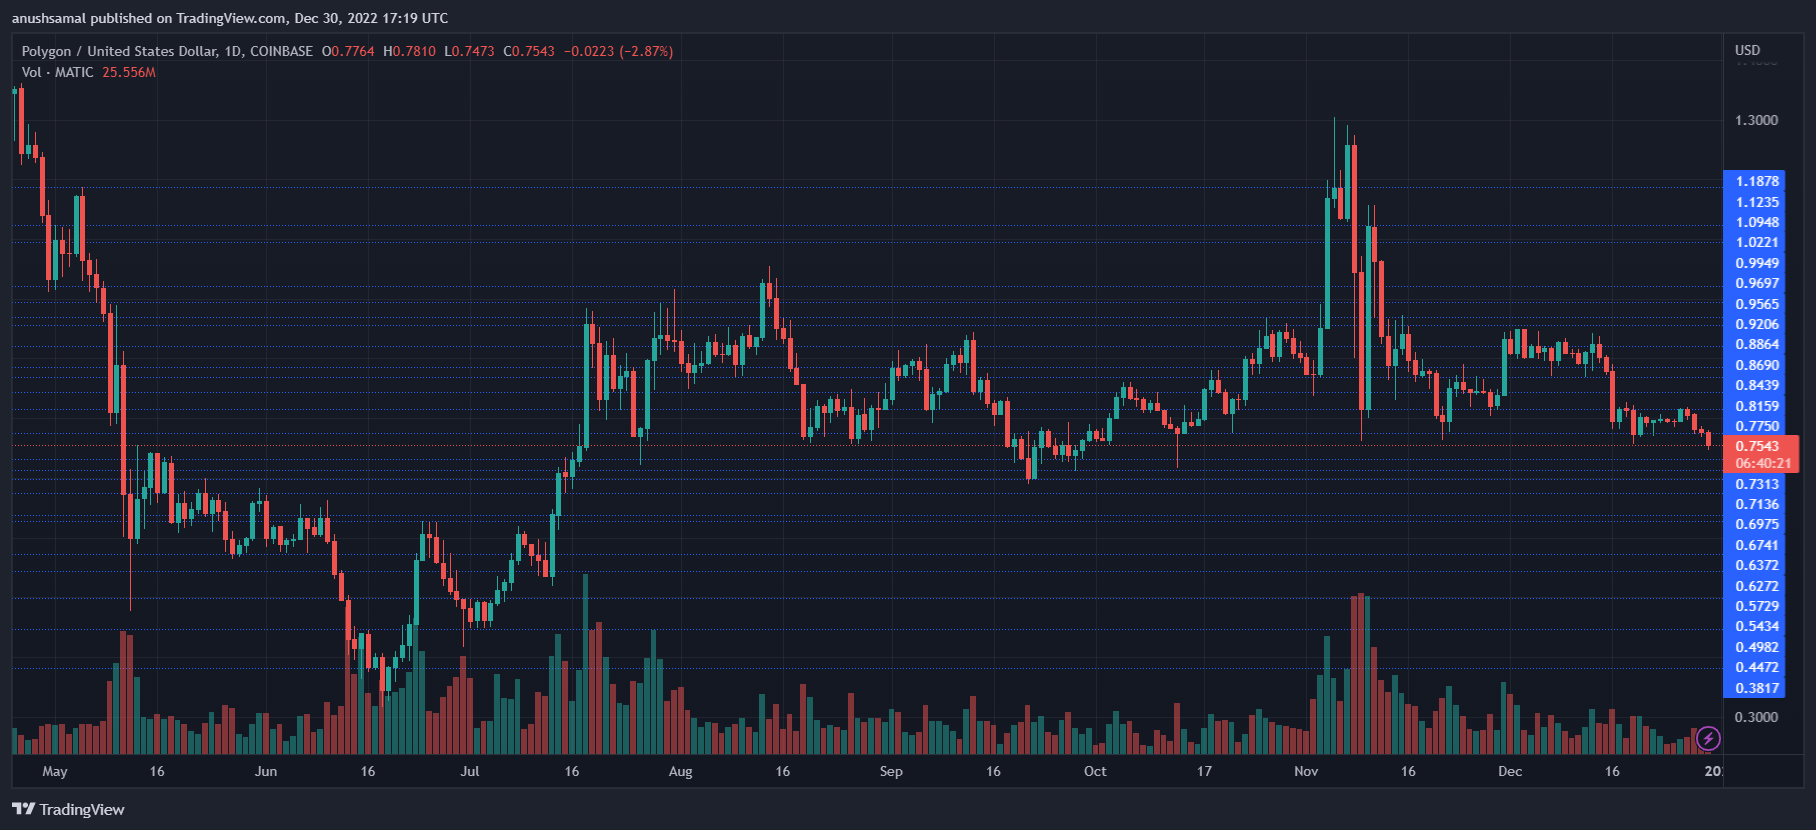
Polygon is trading at $0.76 at the time of writing. This coin is trading very close to the immediate support line of $0.74; one push from the seller and the price can take one more bearish.
Overhead resistance for MATIC is $0.81; crossing this price level will help the altcoin reach $0.84. The $0.84 level has previously been a propelling point for the asset’s price, so it could mean that a move above the $0.84 level will help the coin reverse its price action.
On the other hand, a fall from the current price mark will bring the altcoin to $0.67 and then to $0.63. The number of Polygon traded in the last session is red, indicating the dominance of selling.
Technical Analysis
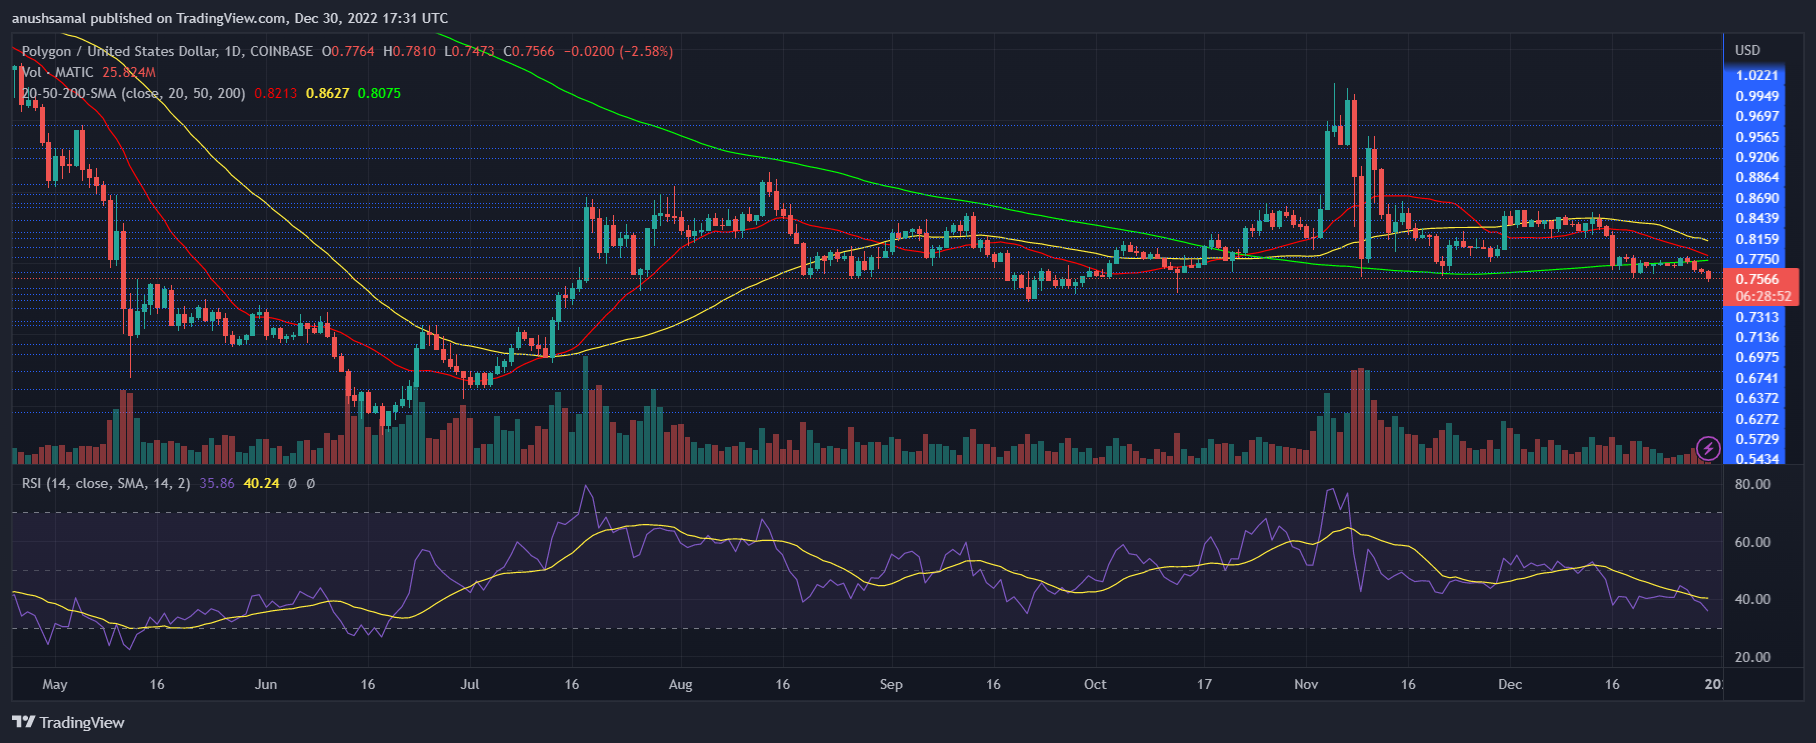
The coin is in the seller’s dominant zone for most of this month. The coin barely recovered after missing the $0.84 support line. The Relative Strength Index is below the 40 mark, which reflects that the coin receives more sellers than buyers.
In correspondence with the same, the coin moved below the 20-Simple Moving Average (SMA) line. This means that sellers push the price momentum in the market.
Usually, when the coin hovers very close to the oversold zone, the price reverses. If it is expected to return, the coin will move above the 200-SMA line (green), which points to a potential rally.
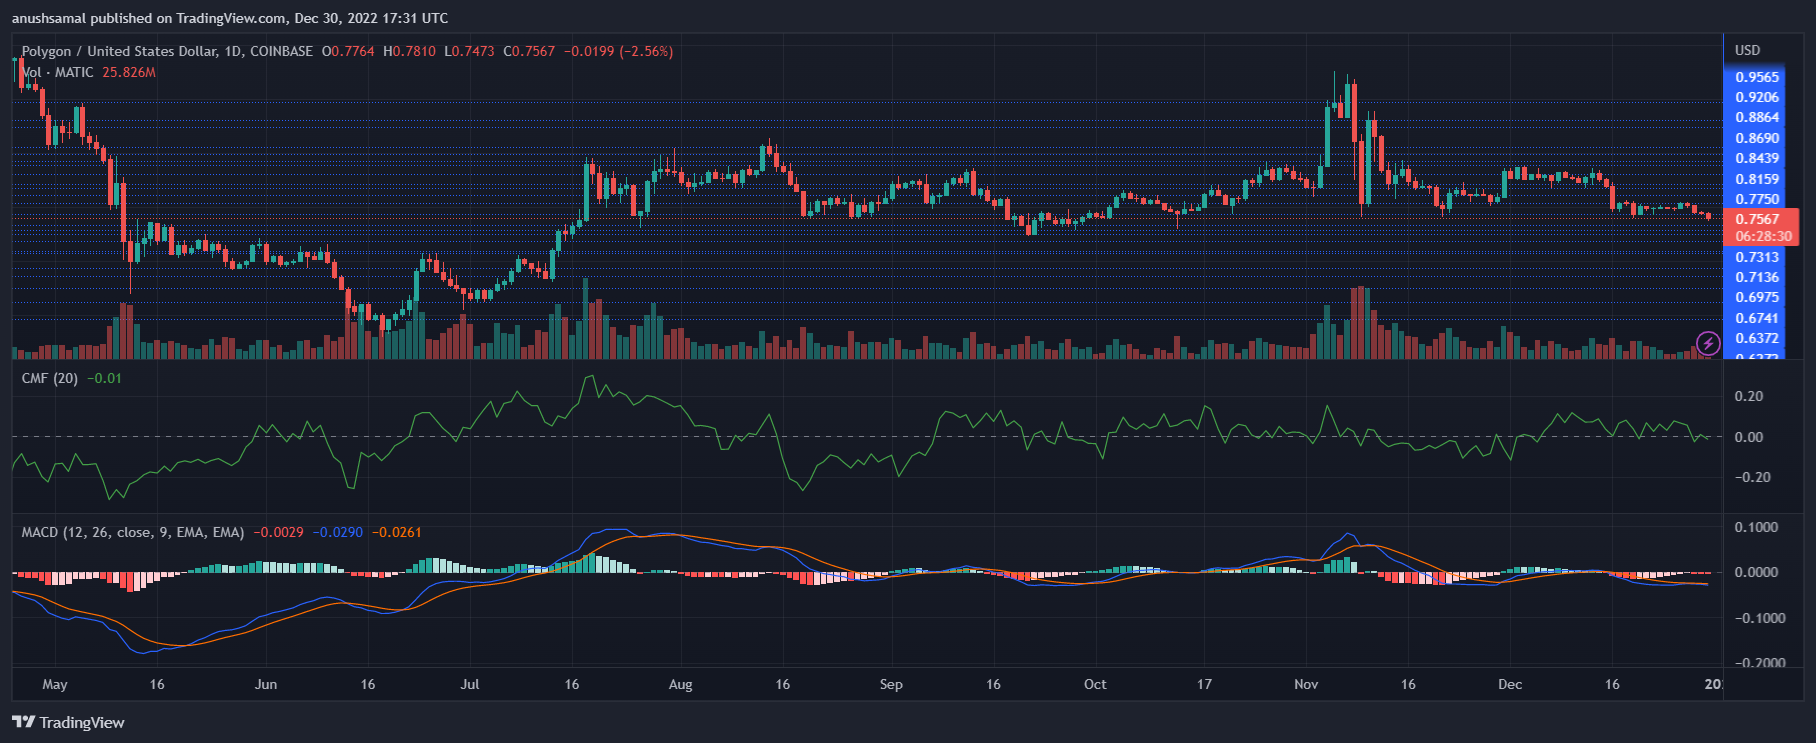
In relation to the selling power, the indicator shows that the sell-off is not over yet. The Moving Average Convergence Divergence (MACD) indicator reflects price momentum and reversals. MACD shows a red signal bar, which is tied to a sell signal.
This is an indication that the coin may go down on the chart. The Chaikin Money Flow reads capital inflows and outflows; The indicator is below the halfway line, which means that capital inflows are lower than outflows.
Featured Images From Unsplash, Graphics From TradingView.com