Ethereum corrected sharply lower and tested $1,500 against the US Dollar. ETH started a new rally and is currently trading above the $1,600 pivot level.
- Ethereum rose above the $1,580 and $1,600 levels.
- The price is currently trading above $1,600 and the hourly simple moving average is 100.
- There is a break above the main bearish trend line with resistance near $1,615 on the ETH/USD hourly chart (data feed via Kraken).
- The pair could rise again if it stays above the $1,600 and $1,580 support levels.
Ethereum Price Resumes Increase
Ethereum price started a sharp downward correction below the $1,600 level. ETH even declined below the $1,550 support zone and the 100 hourly simple moving average.
However, bulls are active near the $1,520 support zone. A low as formed near $1,518 and the price started to increase sharply, similar to bitcoin. There is a sustained rise above the $1,550 and $1,580 resistance levels. The bulls even pushed above the $1,600 level.
Additionally, there is a break above the main bearish trend line with resistance near $1,615 on the ETH/USD hourly chart. The price of ether is currently trading above $1,600 and the hourly simple moving average is 100.
A high formed near $1,639 and the price consolidating gains. It is trading near the 23.6% Fib retracement level of the upward move from the $1,518 swing low to the $1,639 high. Immediate resistance is near the $1,640 level. The next major resistance is near the $1,665 level.
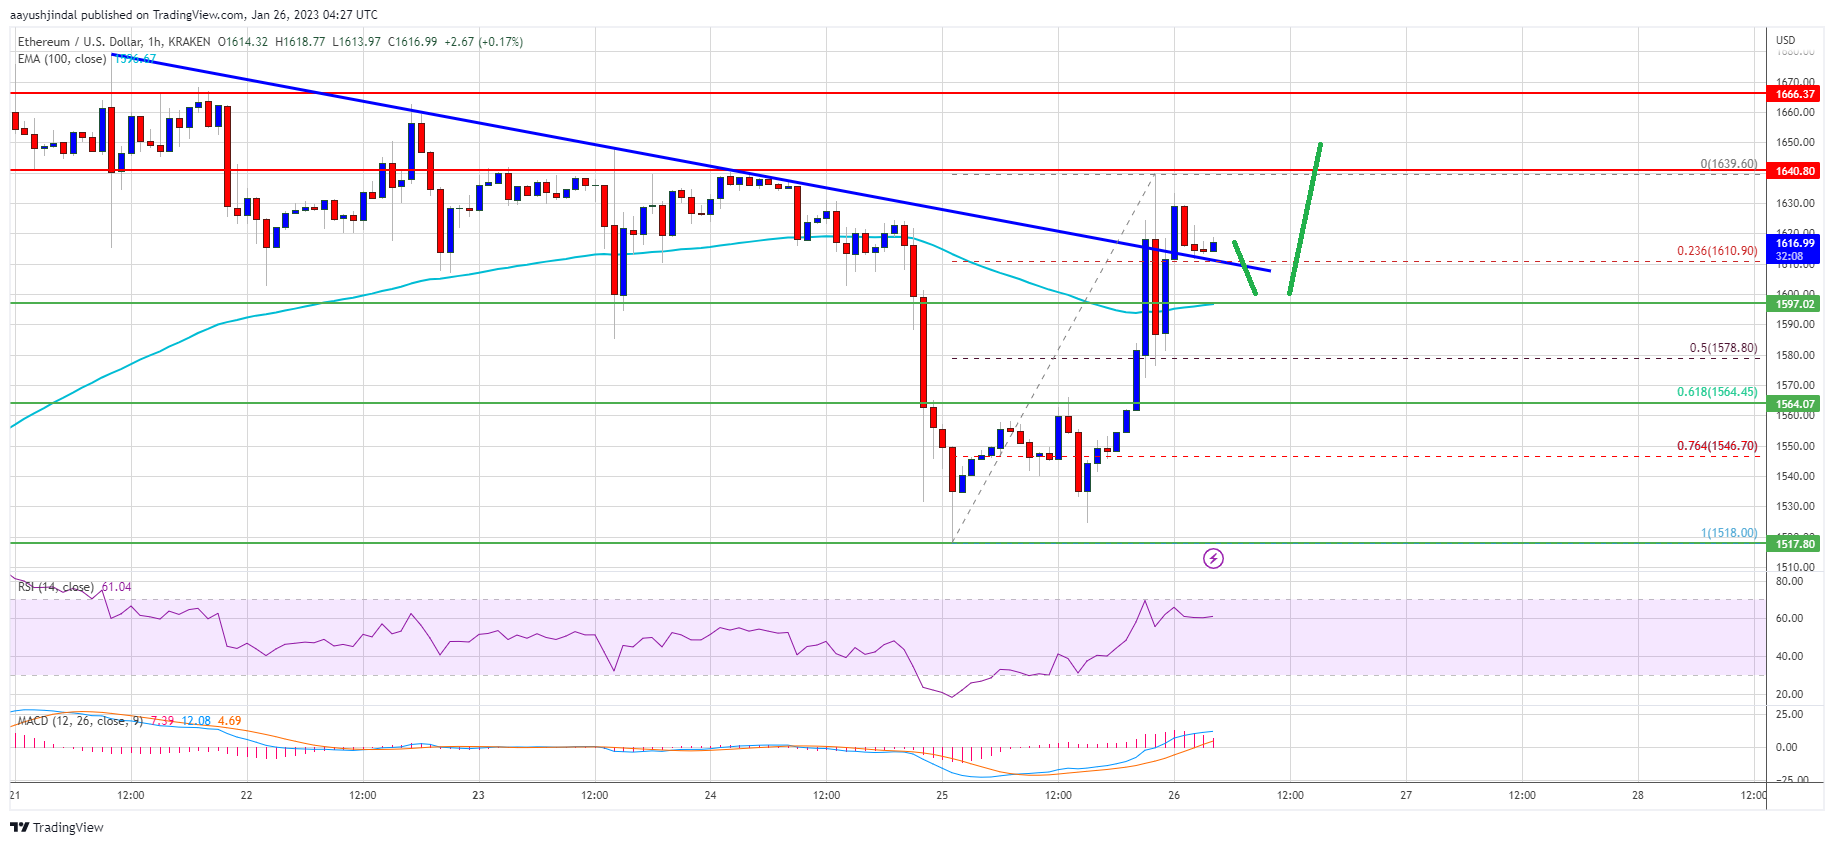
Source: ETHUSD on TradingView.com
A break above the $1,665 resistance zone could start a new rally. In that case, the price may rise towards the $1,720 resistance.
Limited Dips in ETH?
If ethereum fails to clear the $1,640 resistance, it could start another downward correction. Initial support on the downside is near the $1,610 level or the broken trend line.
The next major support is near the $1,580 level or the 50% Fib retracement level of the upward move from the $1,518 swing to the $1,639 high. If there is a break below $1,580, the price could drop to the $1,550 support. Any further losses could prompt a retest of the $1,520 zone.
Technical Indicators
Hourly MACD – The MACD for ETH/USD is currently gaining momentum in the bullish zone.
Hourly RSI – The RSI for ETH/USD is currently above the 50 level.
Key Support Level – $1,580
Main Resistance Level – $1,640